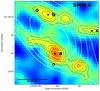
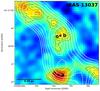
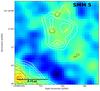
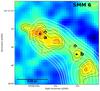
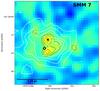
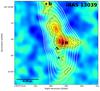
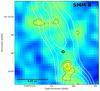
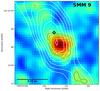
Fig. 4
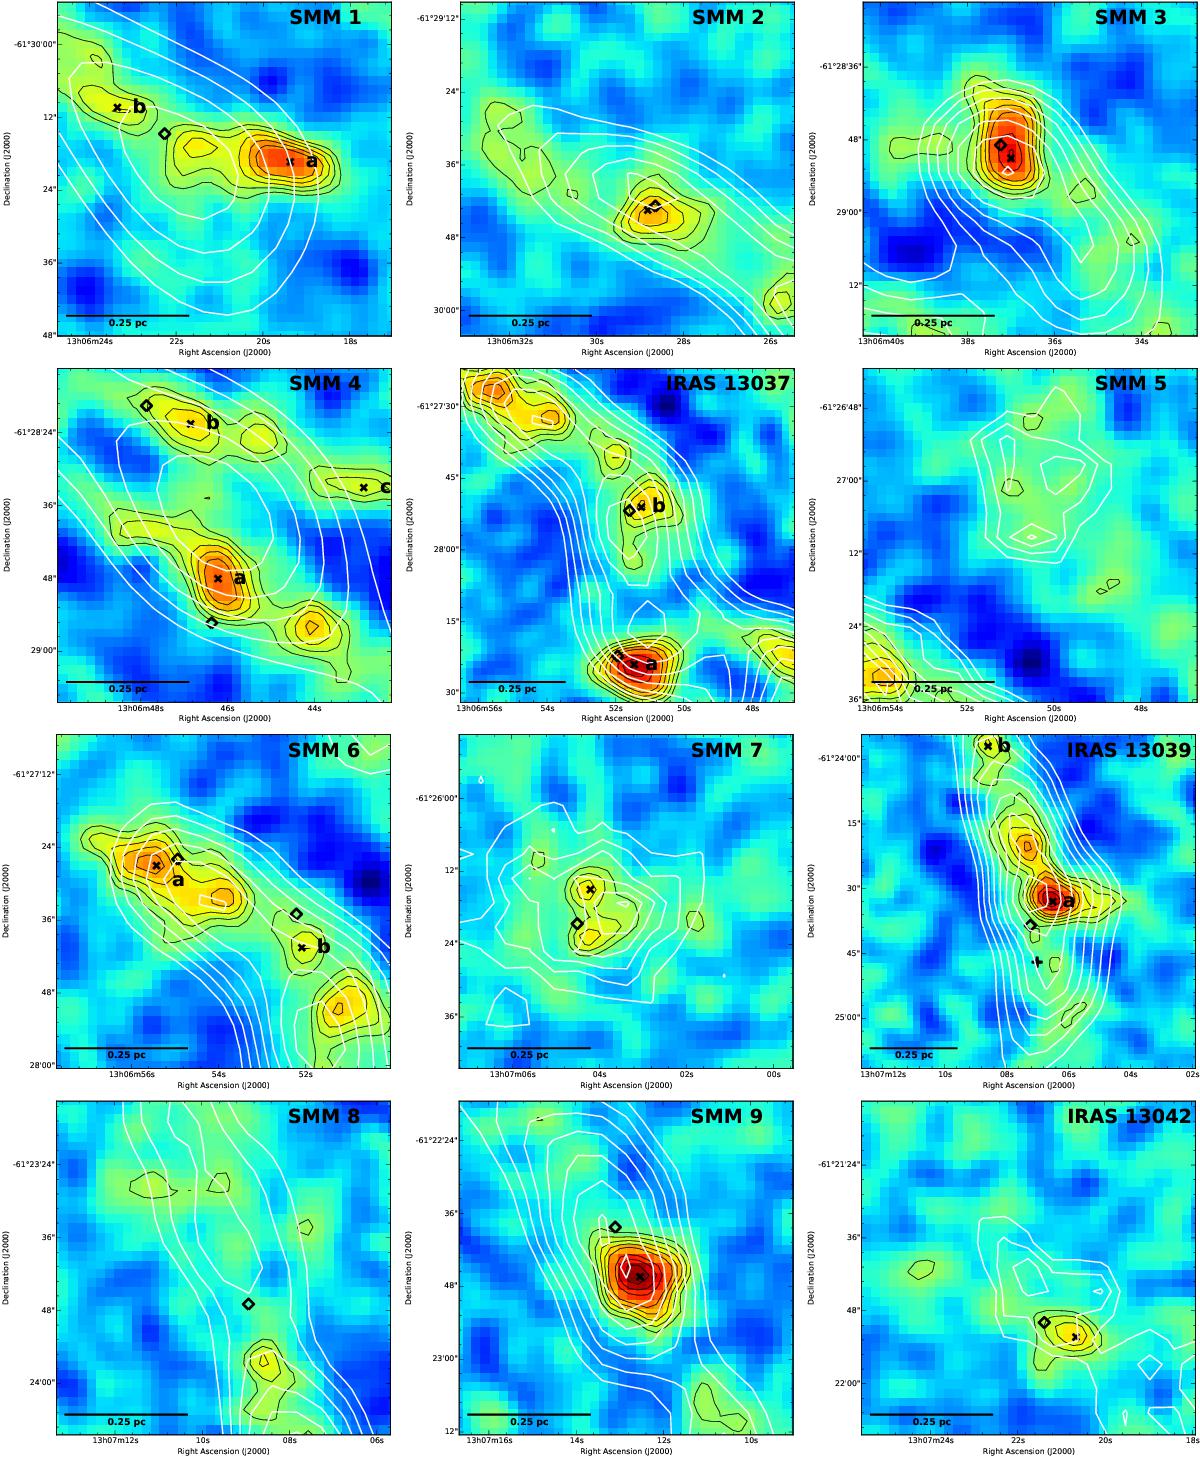
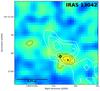
Zoom-in images towards the clumps in G304.74. In each panel, the white contours represent the LABOCA 870 μm emission, while the colour scale (linear scaling) and black contours show the SABOCA 350 μm emission. The contour levels are as in Fig. 1. Each image is centred on the LABOCA peak position of the clump, and is 55″ × 55″ in size with the exception of the IRAS 13037 and IRAS 13039 images, which are 70″ and ![]() on a side, respectively. The crosses indicate the peak positions of the SABOCA 350 μm cores, while the diamond symbols show the positions of the WISE sources from Table 3. The plus sign in the IRAS 13039 image indicates the position of the 18 GHz and 22.8 GHz radio continuum source found by Sánchez-Monge et al. (2013). A scale bar of 0.25 pc is shown in the bottom left corner of each panel.
on a side, respectively. The crosses indicate the peak positions of the SABOCA 350 μm cores, while the diamond symbols show the positions of the WISE sources from Table 3. The plus sign in the IRAS 13039 image indicates the position of the 18 GHz and 22.8 GHz radio continuum source found by Sánchez-Monge et al. (2013). A scale bar of 0.25 pc is shown in the bottom left corner of each panel.
Current usage metrics show cumulative count of Article Views (full-text article views including HTML views, PDF and ePub downloads, according to the available data) and Abstracts Views on Vision4Press platform.
Data correspond to usage on the plateform after 2015. The current usage metrics is available 48-96 hours after online publication and is updated daily on week days.
Initial download of the metrics may take a while.