Fig. 3
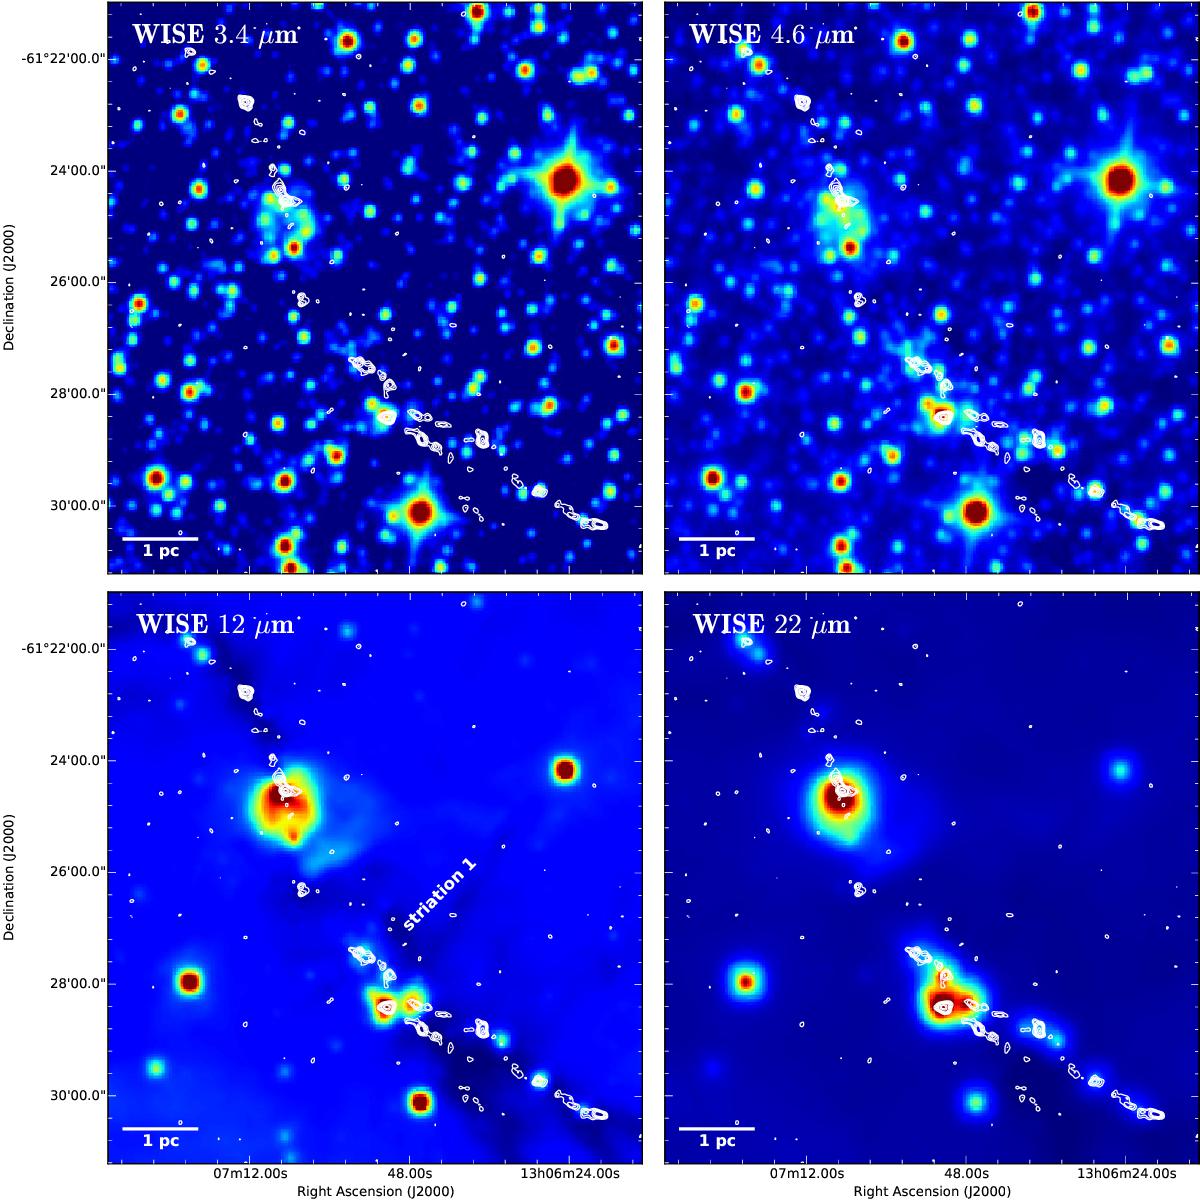
WISE images towards G304.74 overlaid with contours of SABOCA 350 μm dust continuum emission from Fig. 1. The images are shown with logarithmic scaling to improve the colour contrast. A scale bar of 1 pc projected length is shown in the bottom left corner of each panel. The striation 1 is labelled in the 12 μm image, while striation 2 lies outside the image boundary (cf. Fig. 2).

Current usage metrics show cumulative count of Article Views (full-text article views including HTML views, PDF and ePub downloads, according to the available data) and Abstracts Views on Vision4Press platform.
Data correspond to usage on the plateform after 2015. The current usage metrics is available 48-96 hours after online publication and is updated daily on week days.
Initial download of the metrics may take a while.