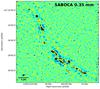
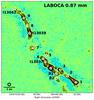
Fig. 1

SABOCA 350 μm (left) and LABOCA 870 μm (right) images of G304.74. In both panels, the colour scale is linear. The contours levels start from 3σ, and progress in steps of 1σ. The dashed contours show the negative features at the − 3σ level. The identified clumps are labelled on the LABOCA map, where the numbers refer to the SMM IDs (e.g. 1 means SMM 1), while the sources I13037, I13039, and I13042 are the three IRAS sources in the filament. The white circles indicate the LABOCA peak positions of the clumps (see Sect. 3.1). The identified SABOCA sources are not labelled for legibility purposes (see Sect. 3.2), but they are indicated in the zoom-in images in Fig. 4. A scale bar of 1 pc projected length, and the effective beam size (9″ for SABOCA, ![]() for LABOCA) are shown in the bottom left corner.
for LABOCA) are shown in the bottom left corner.
Current usage metrics show cumulative count of Article Views (full-text article views including HTML views, PDF and ePub downloads, according to the available data) and Abstracts Views on Vision4Press platform.
Data correspond to usage on the plateform after 2015. The current usage metrics is available 48-96 hours after online publication and is updated daily on week days.
Initial download of the metrics may take a while.