Fig. 2
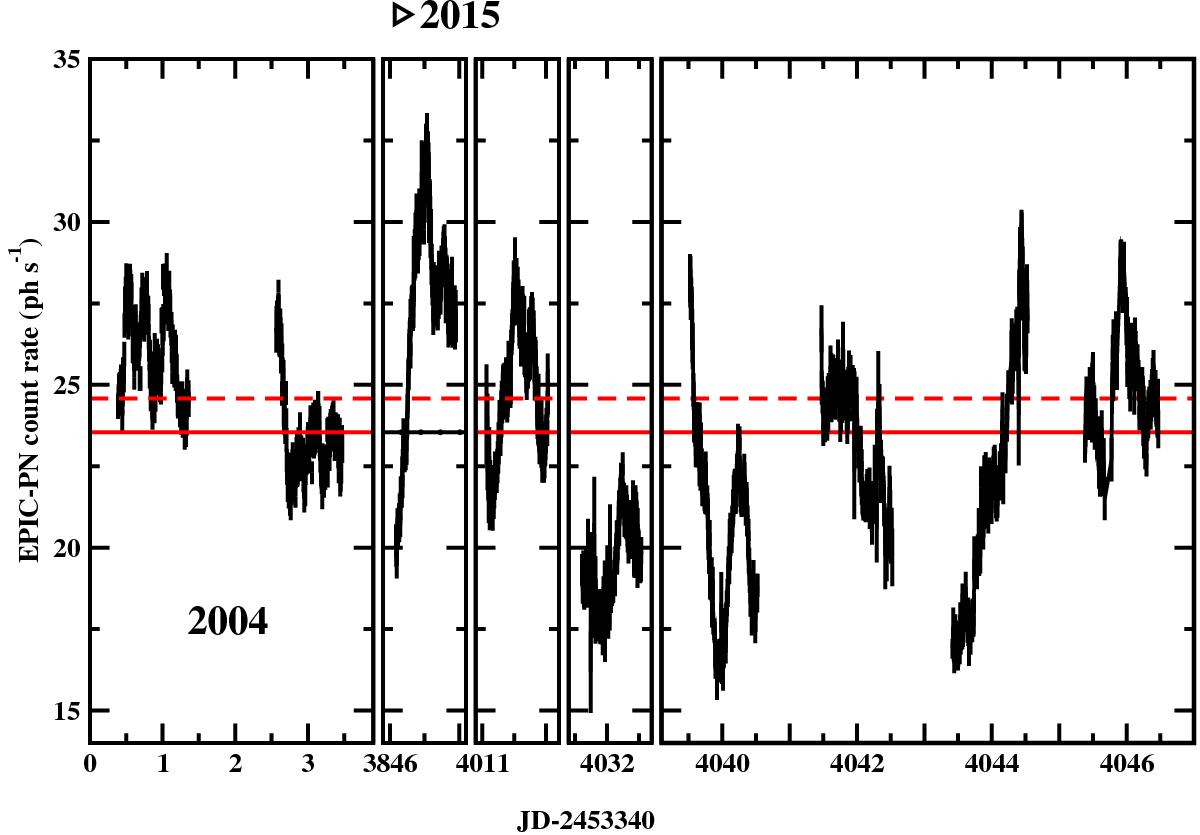
EPIC-pn lightcurves (0.3−10 keV), two observations during 2004 and seven from the 2015 campaign. While on a timescale of a day, the flux from NGC 7469 changes by a factor of two, overall the average flux remains constant - marked by the solid red line. In dashed red is the line defining high and low state, 0,4σ above the average.
Current usage metrics show cumulative count of Article Views (full-text article views including HTML views, PDF and ePub downloads, according to the available data) and Abstracts Views on Vision4Press platform.
Data correspond to usage on the plateform after 2015. The current usage metrics is available 48-96 hours after online publication and is updated daily on week days.
Initial download of the metrics may take a while.