Fig. 5
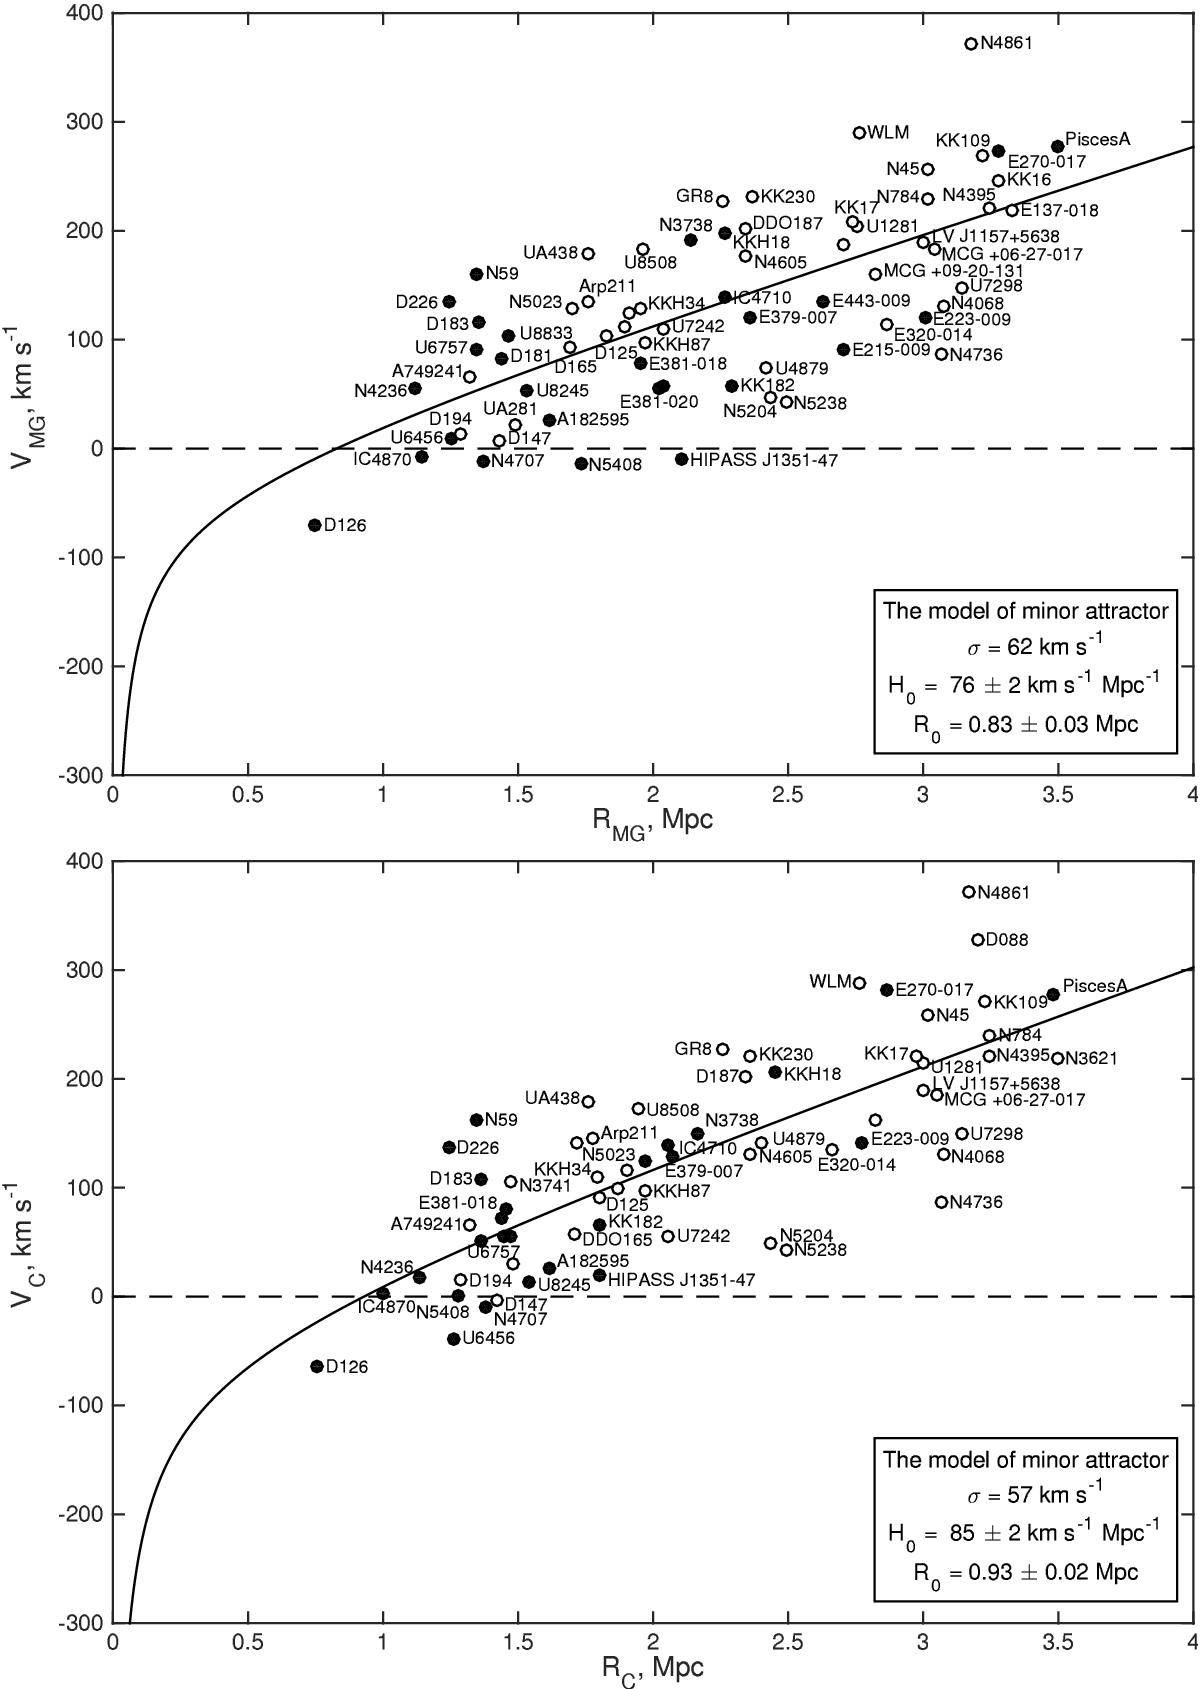
Hubble diagram for the synthetic group of the Local Volume, assuming the minor attractor model. Upper panel: distances and velocities of satellites are calculated relative to the main galaxy in a group. Lower panel: distances and velocities of satellites are calculated relative to the barycentre of a pair of the most massive galaxies in each group.
Current usage metrics show cumulative count of Article Views (full-text article views including HTML views, PDF and ePub downloads, according to the available data) and Abstracts Views on Vision4Press platform.
Data correspond to usage on the plateform after 2015. The current usage metrics is available 48-96 hours after online publication and is updated daily on week days.
Initial download of the metrics may take a while.