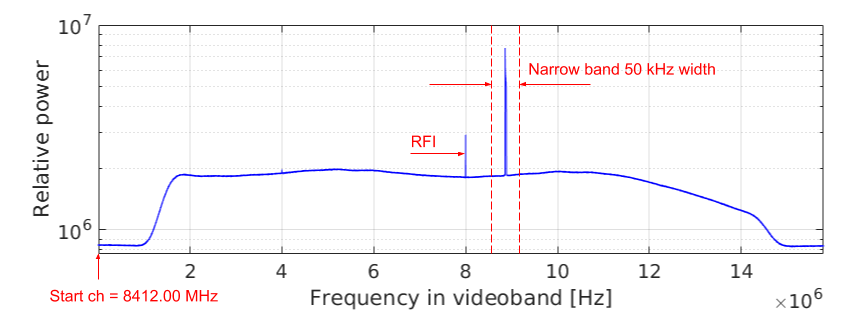
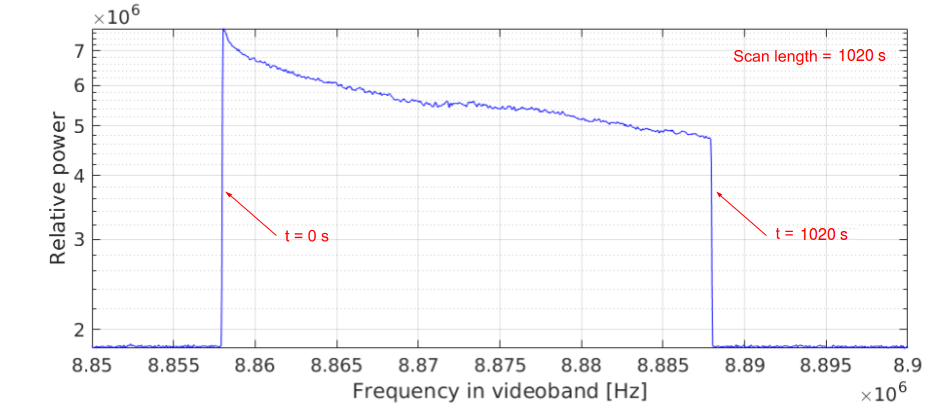
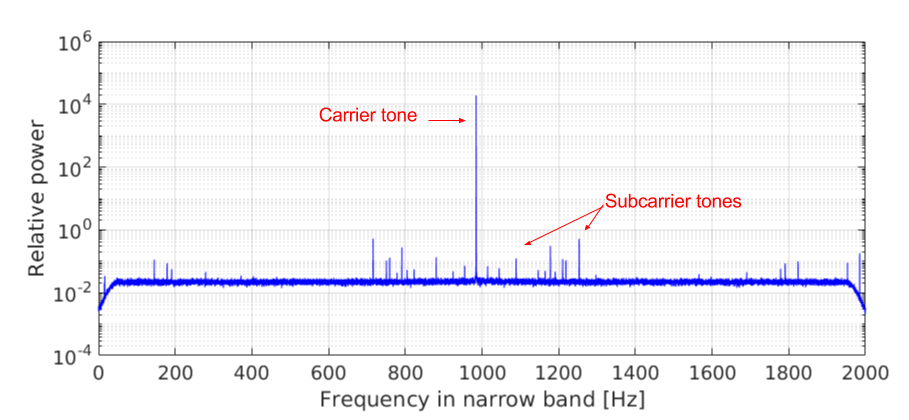
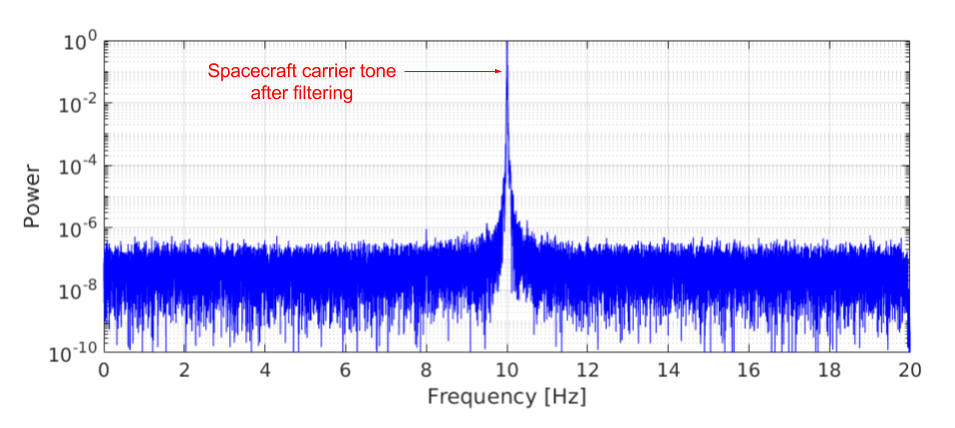
Fig. 1

Example of Doppler data processing pipeline using observations of MEX during Phobos flyby by Hartebeesthoek (see Sect. 3). Panel a shows the typical resulting average power spectrum of a scan after running the SWSpec software. In the 16 MHz pre-defined sub-band starting at 8412 MHz, the spacecraft signal is found in the spectrum. A narrowband containing the moving phase of the spacecraft carrier/tone is selected (in this case of 50 kHz bandwidth) to model the Doppler shift using an n-order polynomial frequency fit. Panel b shows a zoom of the spectrum inside the selected narrowband window to perform the fit. Here the moving phase of the carrier tone is visible along the duration of the scan. After the fit is performed, SCtracker applies the polynomial coefficients after converting the sample to the baseband sample to stop the moving phase of the tone. In this way, SCtracker extracts an initial fit of the Doppler shift. Panel c shows the output of the SCtracker, which is a phase-stopped filtered out signal in a 2 kHz narrowband in baseband. Finally, the dPLL performs high-precision iterations of the time integration of the overlapped spectra, phase polynomial fitting, conversion to baseband, and phase-stopping corrections, using narrowband windows around the carrier tone. The iterations stop when the window bandwidth reaches 20 Hz, as shown in panel d, allowing the extraction of the frequency and phase residuals of the spacecraft carrier tone with a 2 mHz frequency spectral resolution.
Current usage metrics show cumulative count of Article Views (full-text article views including HTML views, PDF and ePub downloads, according to the available data) and Abstracts Views on Vision4Press platform.
Data correspond to usage on the plateform after 2015. The current usage metrics is available 48-96 hours after online publication and is updated daily on week days.
Initial download of the metrics may take a while.