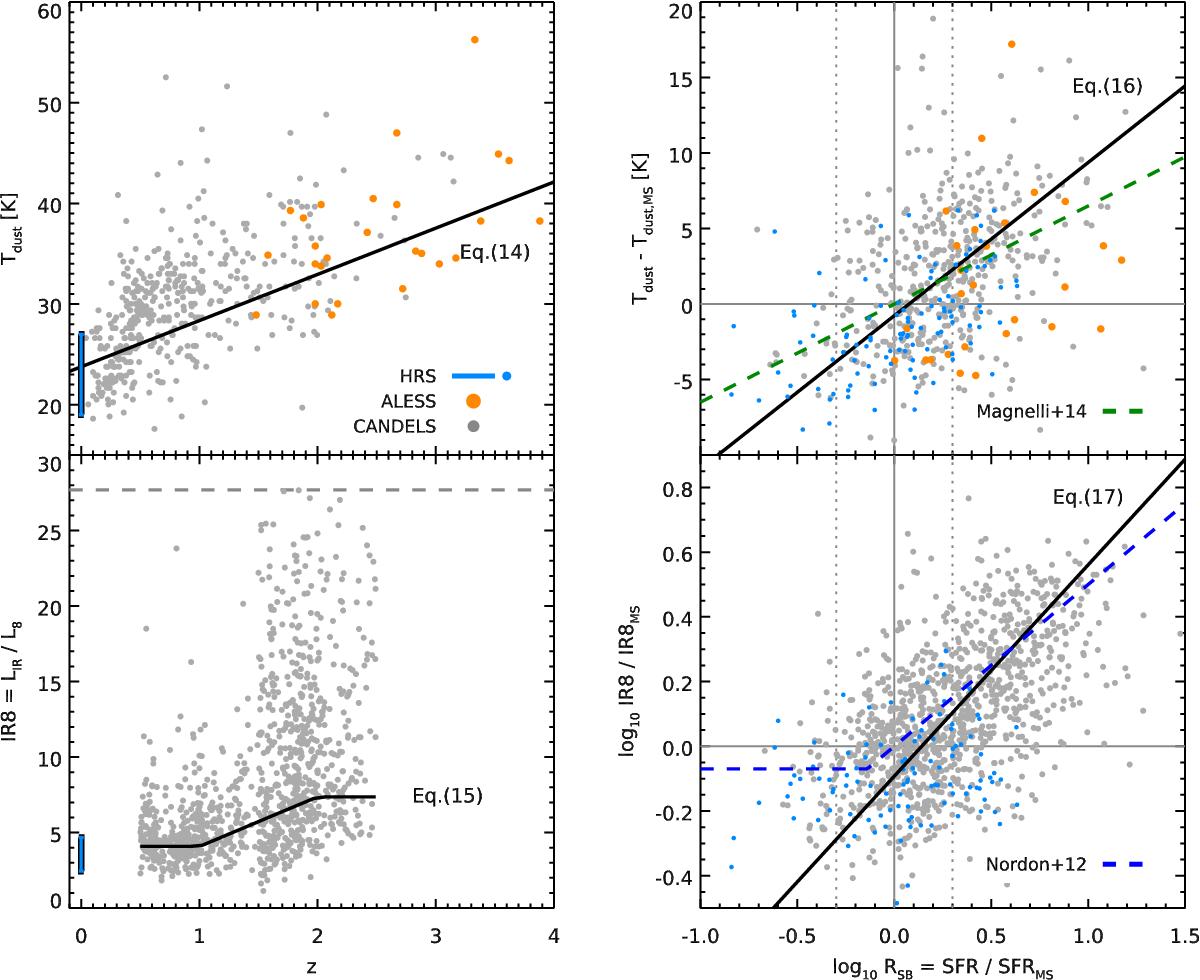
Fig. 9
Left: evolution of the dust temperature (Tdust, top) and IR8 ≡ LIR/L8 (bottom) of galaxies individually detected with Herschel in the CANDELS fields (gray dots), from ALESS (orange circles) and the HRS (blue circles or range). We overplot the trends found in stacking (Sect. 4.1) with solid black lines. The dashed horizontal line indicates the maximum IR8 value that our library can reach. Right: evolution of Tdust (top) and IR8 (bottom) with the starburstiness (RSB, see text). The legend is the same as for the plots on the left, except that here the black solid line shows our best-fit relation to the data. For Tdust we show the relation previously found by Magnelli et al. (2014) with a dashed green line, and for IR8 we show the relation of Nordon et al. (2012) with a dashed blue line.
Current usage metrics show cumulative count of Article Views (full-text article views including HTML views, PDF and ePub downloads, according to the available data) and Abstracts Views on Vision4Press platform.
Data correspond to usage on the plateform after 2015. The current usage metrics is available 48-96 hours after online publication and is updated daily on week days.
Initial download of the metrics may take a while.