Fig. 8
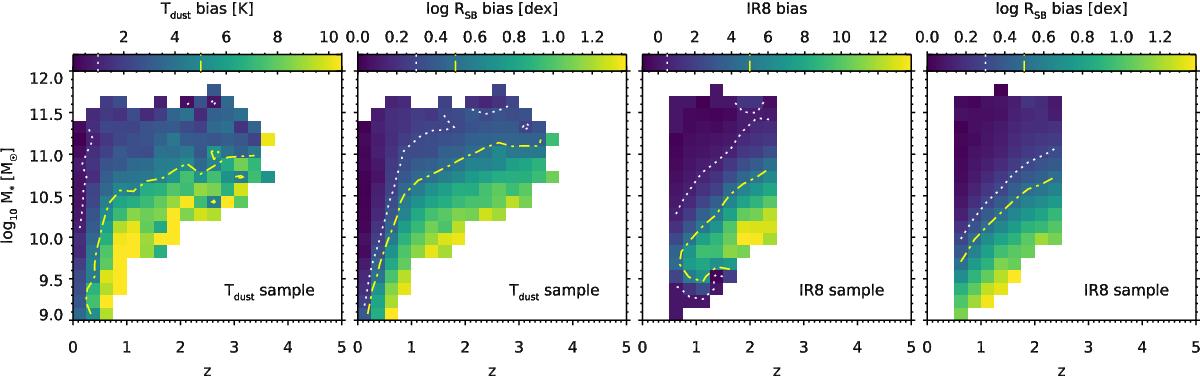
Left: bias in the average Tdust as a function of redshift and mass, computed from the mock catalog and for the “robust Tdust” sample. Each cell of the plot shows the difference between the observed average Tdust in the mock and the true average of the mock in the corresponding bin of redshift and mass. Biases of 1 and 5K are shown with white and yellow lines, respectively. Center-left: same plot, but showing instead the bias in “starburstiness” (RSB), or offset from the main sequence. Biases of a factor two and three are shown with white and yellow lines, respectively. Center-right: same as left, but showing the bias in IR8 for the “robust IR8” sample. Biases of 0.5 and 5 are shown with white and yellow lines, respectively. Right: same as center-left, but for the “robust IR8” sample.
Current usage metrics show cumulative count of Article Views (full-text article views including HTML views, PDF and ePub downloads, according to the available data) and Abstracts Views on Vision4Press platform.
Data correspond to usage on the plateform after 2015. The current usage metrics is available 48-96 hours after online publication and is updated daily on week days.
Initial download of the metrics may take a while.