Fig. 7
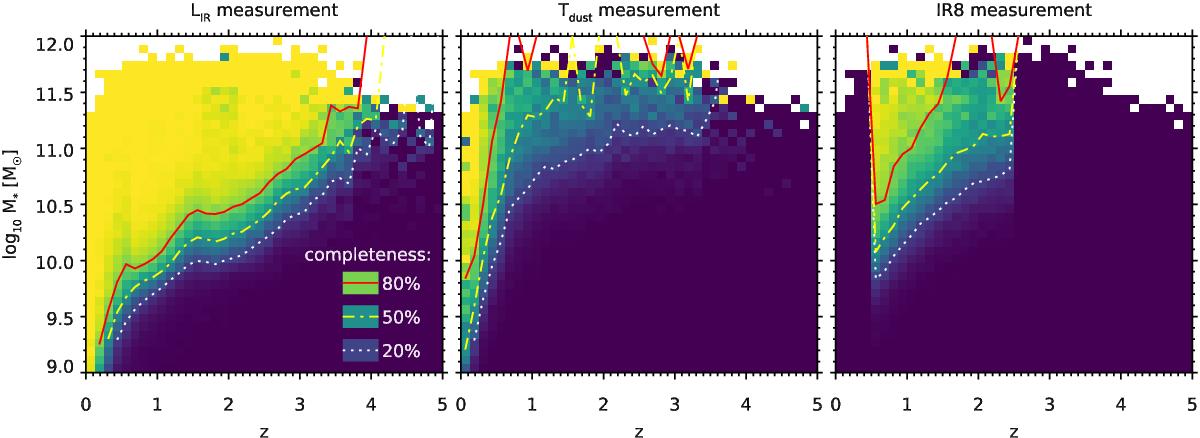
Left: completeness of a CANDELS-like sample computed from the mock catalog, limited to galaxies with a measurement of LIR with S/N > 3, from either Spitzer MIPS or Herschel. The completeness is shown as a function of redshift and stellar mass: each cell of the plot displays the completeness is the corresponding bin of redshift and mass. The 80, 50 and 20% completeness levels are indicated with red, yellow and white lines, respectively. Center: same as left, but limited to the sample with a robust Tdust measurement. Right: same as left, but limited to the sample with a robust IR8 measurement.
Current usage metrics show cumulative count of Article Views (full-text article views including HTML views, PDF and ePub downloads, according to the available data) and Abstracts Views on Vision4Press platform.
Data correspond to usage on the plateform after 2015. The current usage metrics is available 48-96 hours after online publication and is updated daily on week days.
Initial download of the metrics may take a while.