Free Access
Fig. 6
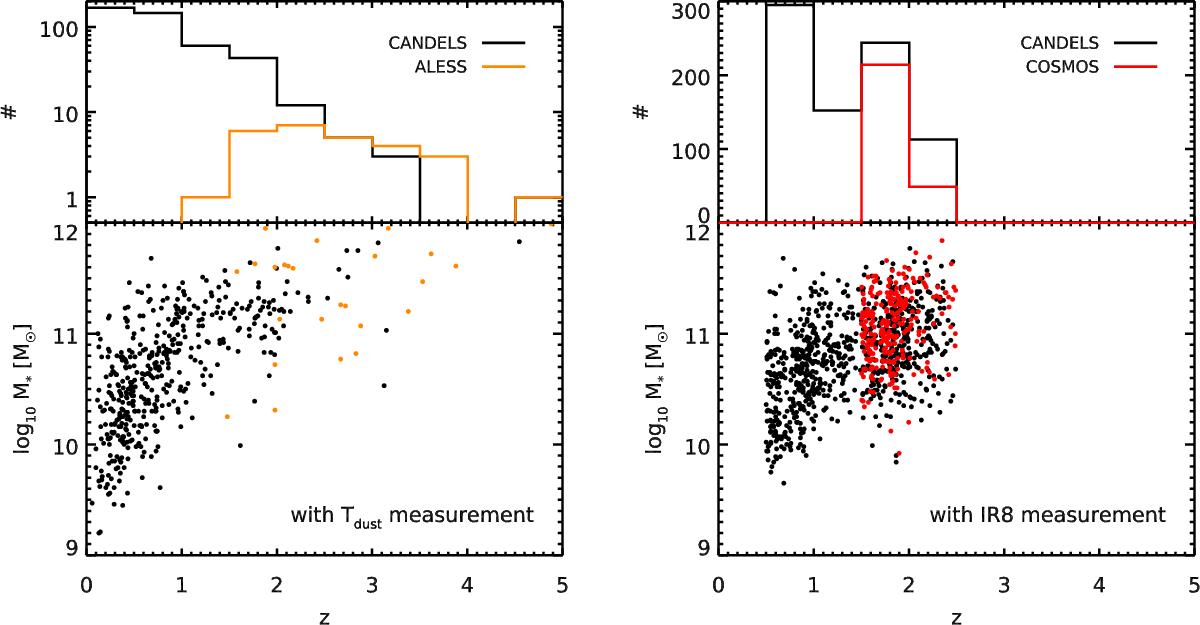
Distribution of galaxies with a Tdust (left) or IR8 (right) measurement in the M∗-redshift plane. The galaxies from CANDELS are shown with black circles, that from the larger COSMOS field in red, and the smaller sample of ALESS galaxies is shown in orange. At the top we display the redshift distribution of each sample.
Current usage metrics show cumulative count of Article Views (full-text article views including HTML views, PDF and ePub downloads, according to the available data) and Abstracts Views on Vision4Press platform.
Data correspond to usage on the plateform after 2015. The current usage metrics is available 48-96 hours after online publication and is updated daily on week days.
Initial download of the metrics may take a while.