Fig. 4
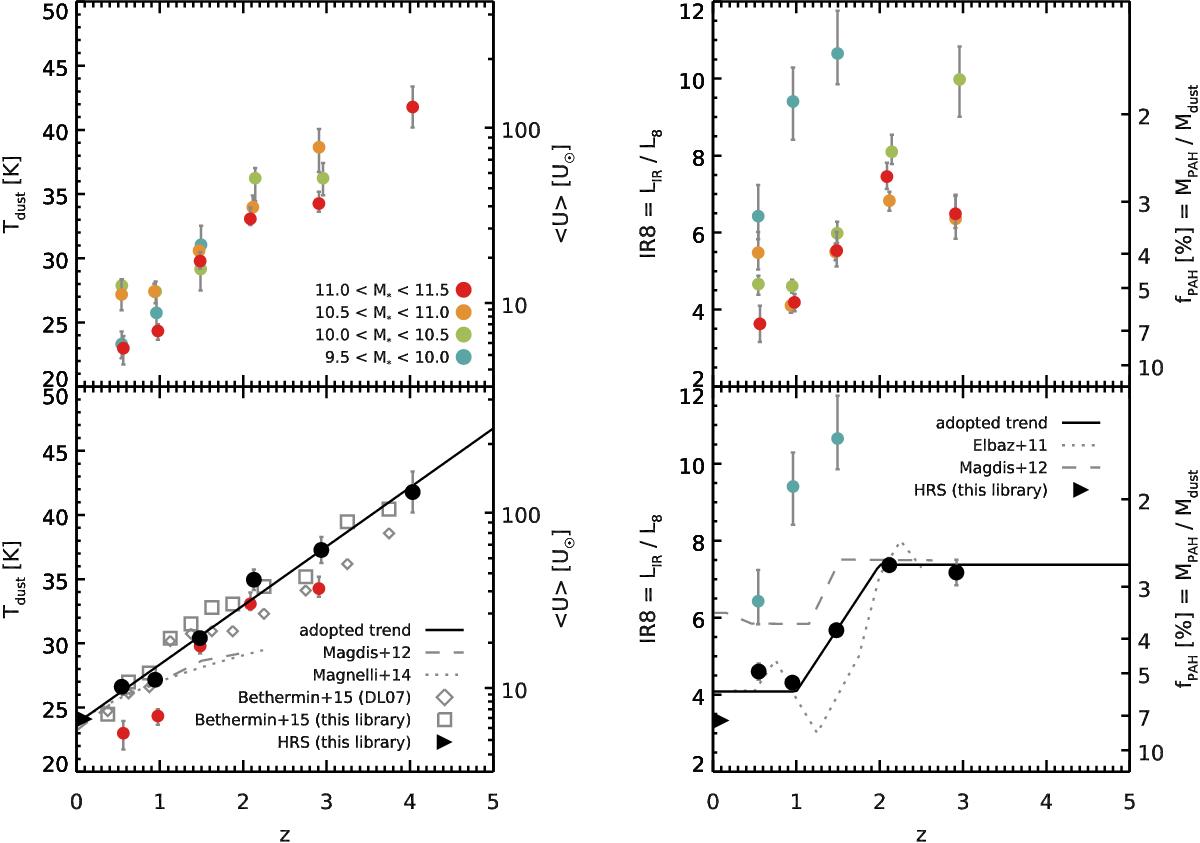
Left: evolution of the effective dust temperature Tdust with redshift. The Tdust estimated from each stacked SED at different stellar masses are shown on the top plot with circles of different colors (see legend). The bottom plot shows the weighted mean of all mass bins as black circles (excluding the most massive bin, shown in red, or the least massive bin, shown in blue). The average of the galaxies from the HRS (Schreiber et al. 2016; Ciesla et al. 2014) is given with a solid triangle. The trend we adopt in this paper is shown with a solid black line. We also show the Tdust evolution of Magdis et al. (2012) and Béthermin et al. (2015; both converted from ⟨U⟩ to Tdust using Eq. (5)) as well as Magnelli et al. (2014; corrected from light-weighted to mass-weighted using Eq. (6)). We also show the best fitting temperature to the Béthermin et al. (2015) SEDs modeled with our own library as open squares. Right: evolution of the IR8 ratio with redshift. The legends are the same as for the plots on the left, except that here we show the values obtained by Magdis et al. (2012, computed from their best-fit template SEDs) and Elbaz et al. (2011).
Current usage metrics show cumulative count of Article Views (full-text article views including HTML views, PDF and ePub downloads, according to the available data) and Abstracts Views on Vision4Press platform.
Data correspond to usage on the plateform after 2015. The current usage metrics is available 48-96 hours after online publication and is updated daily on week days.
Initial download of the metrics may take a while.