Fig. 2
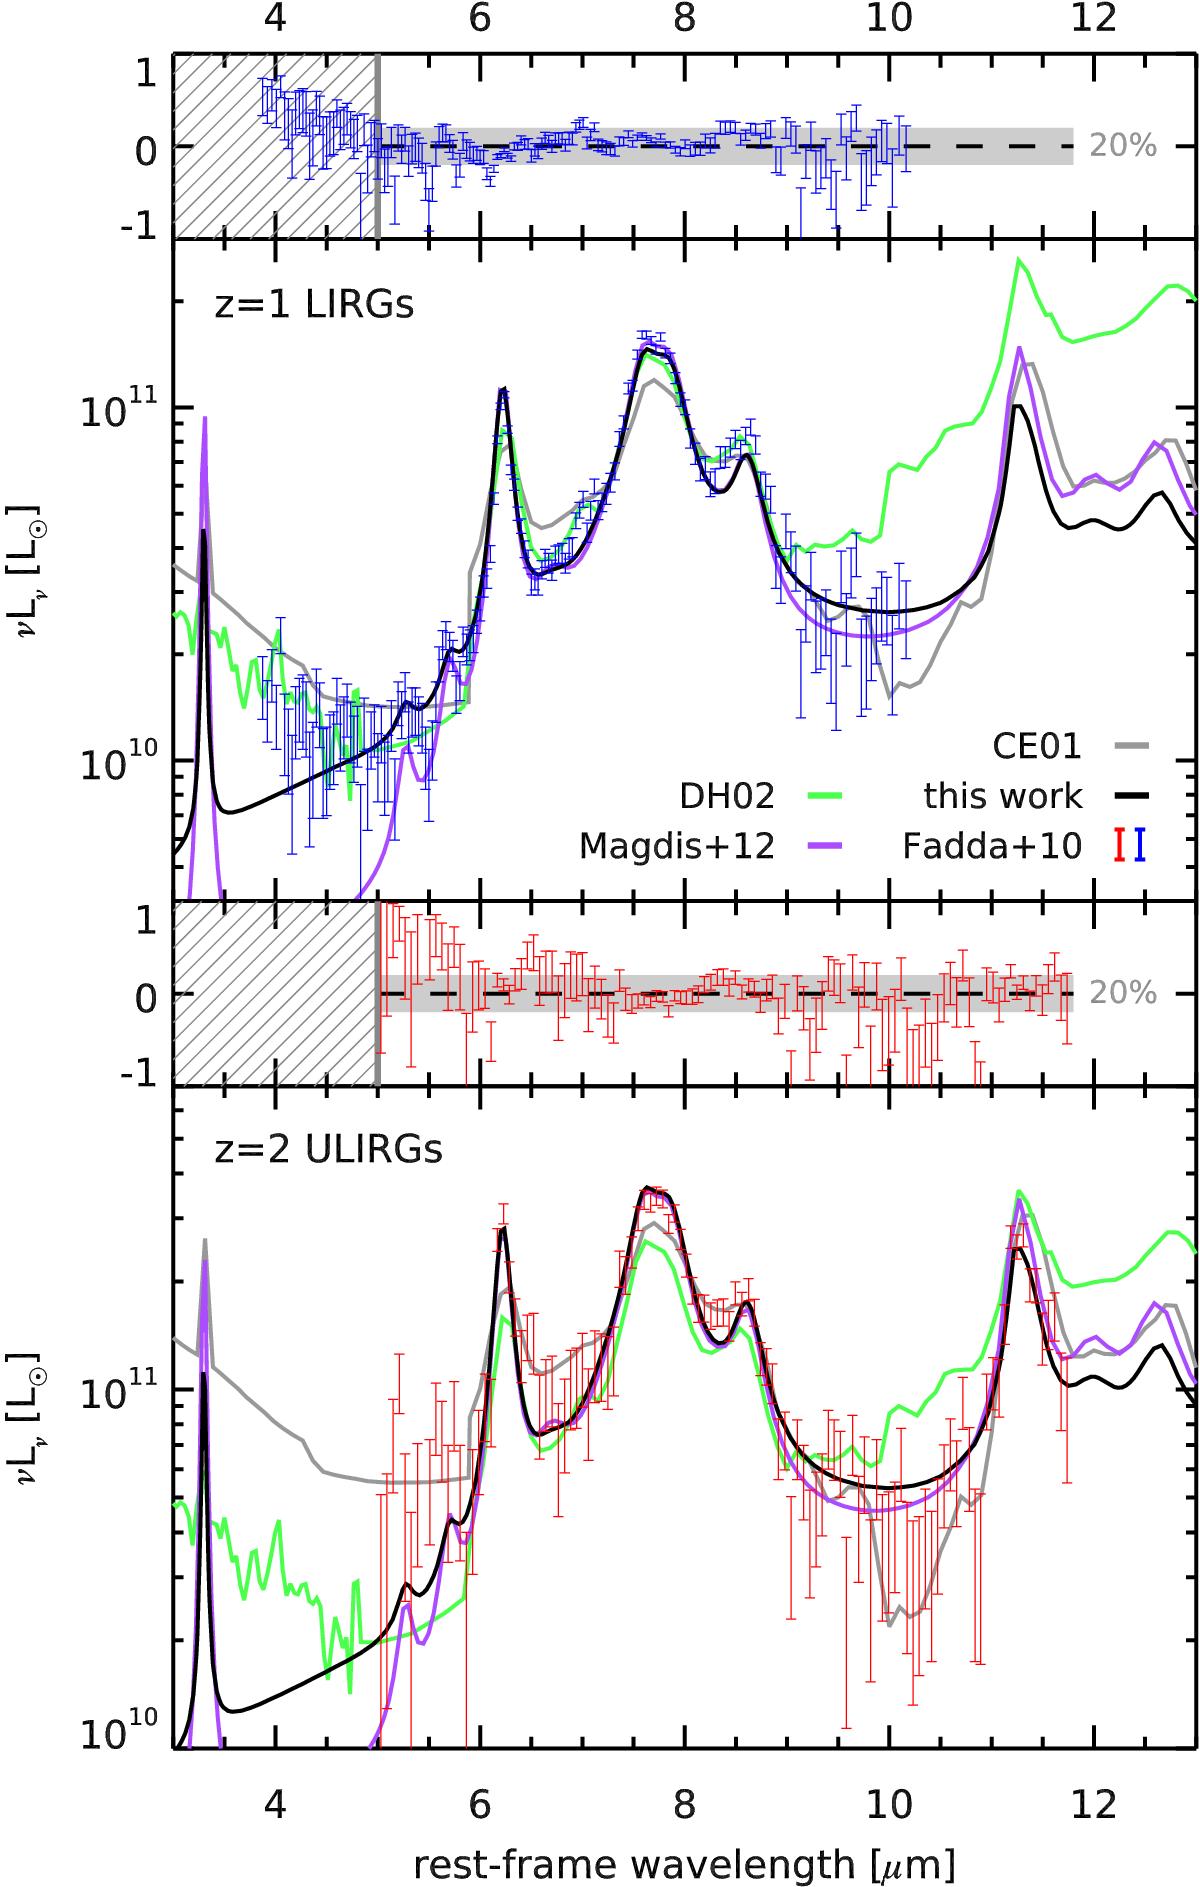
Comparison of the our templates (black solid line) against stacked Spitzer IRS spectra of z = 1 LIRGs (blue, top) and z = 2 ULIRGs (red, bottom) from Fadda et al. (2010). The relative residuals of the fits are shown above the plot for each sample; the region of perfect agreement is shown with a dashed line, surrounded by a ±20% confidence interval. We also show the best fit using other models: CE01 (gray), DH02 (green), and Magdis et al. (2012; purple). In all cases the fit only uses observations at λ> 5 μm, since shorter wavelength can be contaminated by the stellar continuum, as illustrated with the hashed region in the residual plots.
Current usage metrics show cumulative count of Article Views (full-text article views including HTML views, PDF and ePub downloads, according to the available data) and Abstracts Views on Vision4Press platform.
Data correspond to usage on the plateform after 2015. The current usage metrics is available 48-96 hours after online publication and is updated daily on week days.
Initial download of the metrics may take a while.