Fig. 12
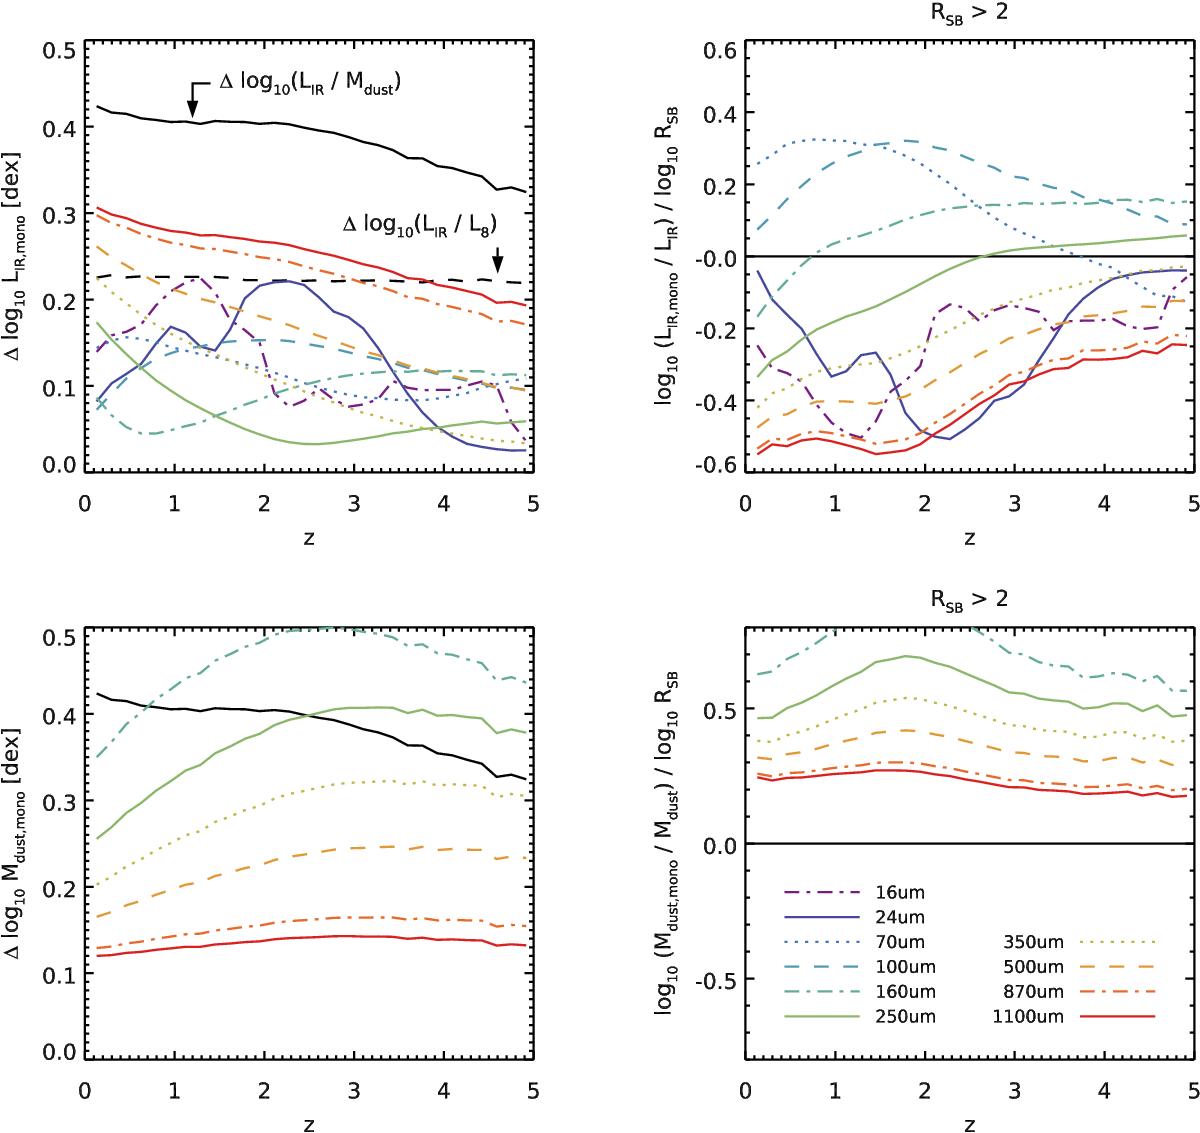
Top left: predicted evolution of the uncertainty in ![]() , that is, the LIR inferred from a single broadband photometric measurement, each band corresponding to a different color and line style (see legend). This uncertainty is derived by measuring the standard deviation of the difference between the true LIR that was put in the simulated catalog and the observed monochromatic rest-frame luminosity. This is an optimal uncertainty, assuming 1) no error on the measured flux, 2) knowledge of the best average LIR/Lν conversion factor (i.e., the best average SED), 3) perfect subtraction of the stellar component (which only matters for 16 and 24 μm at high-redshift), and 4) no contamination from AGNs. For comparison, we show with a black solid and dashed lines the logarithmic scatter in LIR/Mdust and LIR/L8 in the sample at each redshift, which are the main drivers of SED variations at λ> 30 and λ< 30 μm in our model, respectively. Top right: predicted systematic error on the LIR of starburst galaxies (selected here with RSB> 2) normalized to the galaxies’ offset from the main sequence. In other words, a value of x on this plot means that the LIR will be wrong on average by a factor
, that is, the LIR inferred from a single broadband photometric measurement, each band corresponding to a different color and line style (see legend). This uncertainty is derived by measuring the standard deviation of the difference between the true LIR that was put in the simulated catalog and the observed monochromatic rest-frame luminosity. This is an optimal uncertainty, assuming 1) no error on the measured flux, 2) knowledge of the best average LIR/Lν conversion factor (i.e., the best average SED), 3) perfect subtraction of the stellar component (which only matters for 16 and 24 μm at high-redshift), and 4) no contamination from AGNs. For comparison, we show with a black solid and dashed lines the logarithmic scatter in LIR/Mdust and LIR/L8 in the sample at each redshift, which are the main drivers of SED variations at λ> 30 and λ< 30 μm in our model, respectively. Top right: predicted systematic error on the LIR of starburst galaxies (selected here with RSB> 2) normalized to the galaxies’ offset from the main sequence. In other words, a value of x on this plot means that the LIR will be wrong on average by a factor ![]() . Bottom left and right: same as top, but for
. Bottom left and right: same as top, but for ![]() .
.
Current usage metrics show cumulative count of Article Views (full-text article views including HTML views, PDF and ePub downloads, according to the available data) and Abstracts Views on Vision4Press platform.
Data correspond to usage on the plateform after 2015. The current usage metrics is available 48-96 hours after online publication and is updated daily on week days.
Initial download of the metrics may take a while.