Fig. 11
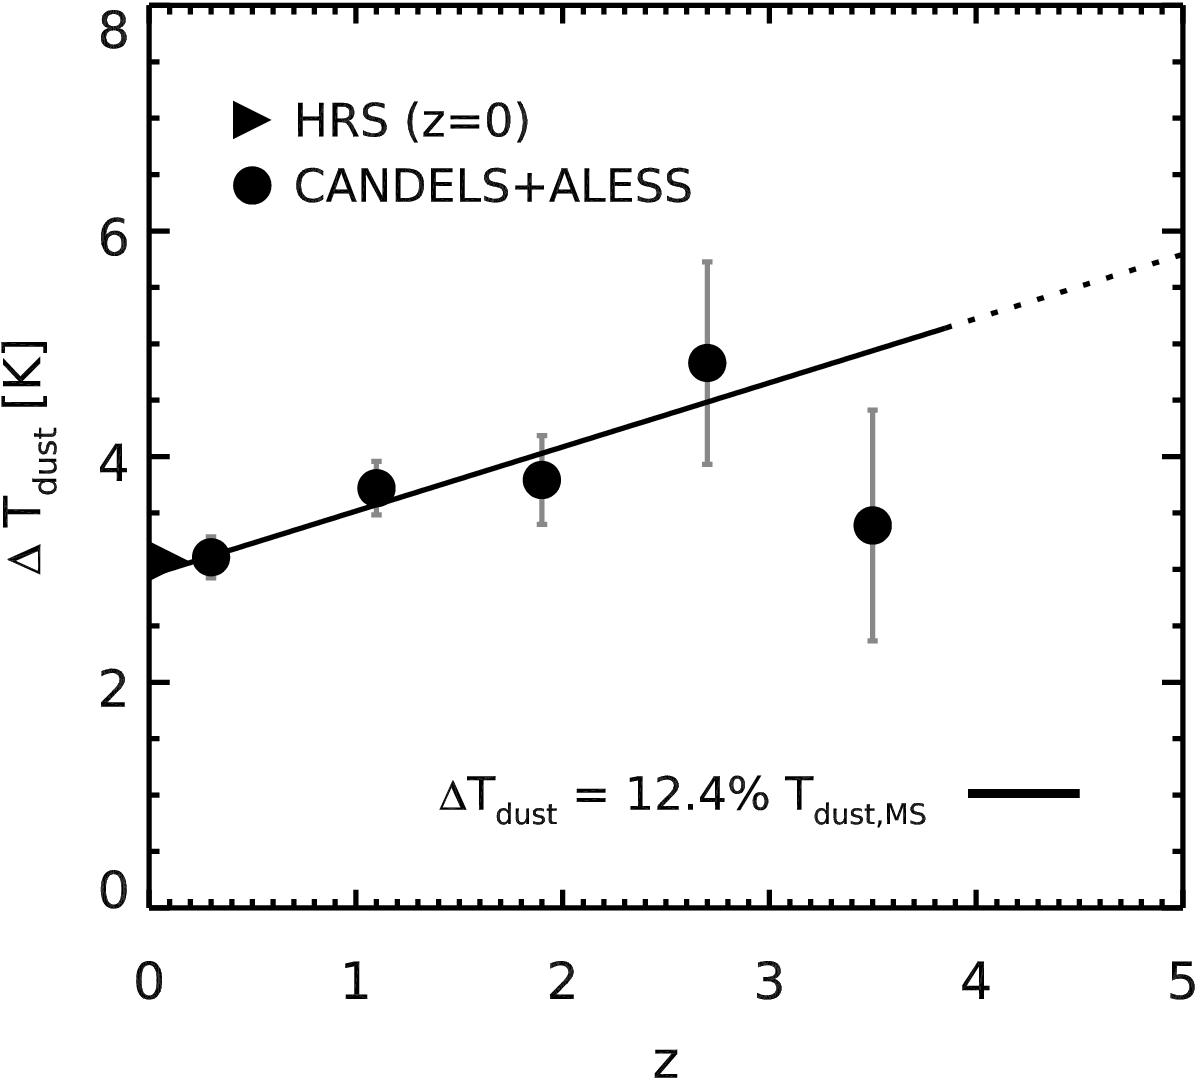
Residual intrinsic scatter of Tdust, obtained after removing the redshift evolution (Eq. (15)) and starburstiness dependence (Eq. (18)), and subtracting statistically the uncertainty on the Tdust measurements and on the redshift. Measurements of the scatter in CANDELS and ALESS are shown with solid circles, and the HRS is shown with a solid triangle. The trend with redshift is modeled as a constant relative uncertainty (black line).
Current usage metrics show cumulative count of Article Views (full-text article views including HTML views, PDF and ePub downloads, according to the available data) and Abstracts Views on Vision4Press platform.
Data correspond to usage on the plateform after 2015. The current usage metrics is available 48-96 hours after online publication and is updated daily on week days.
Initial download of the metrics may take a while.