Fig. 10
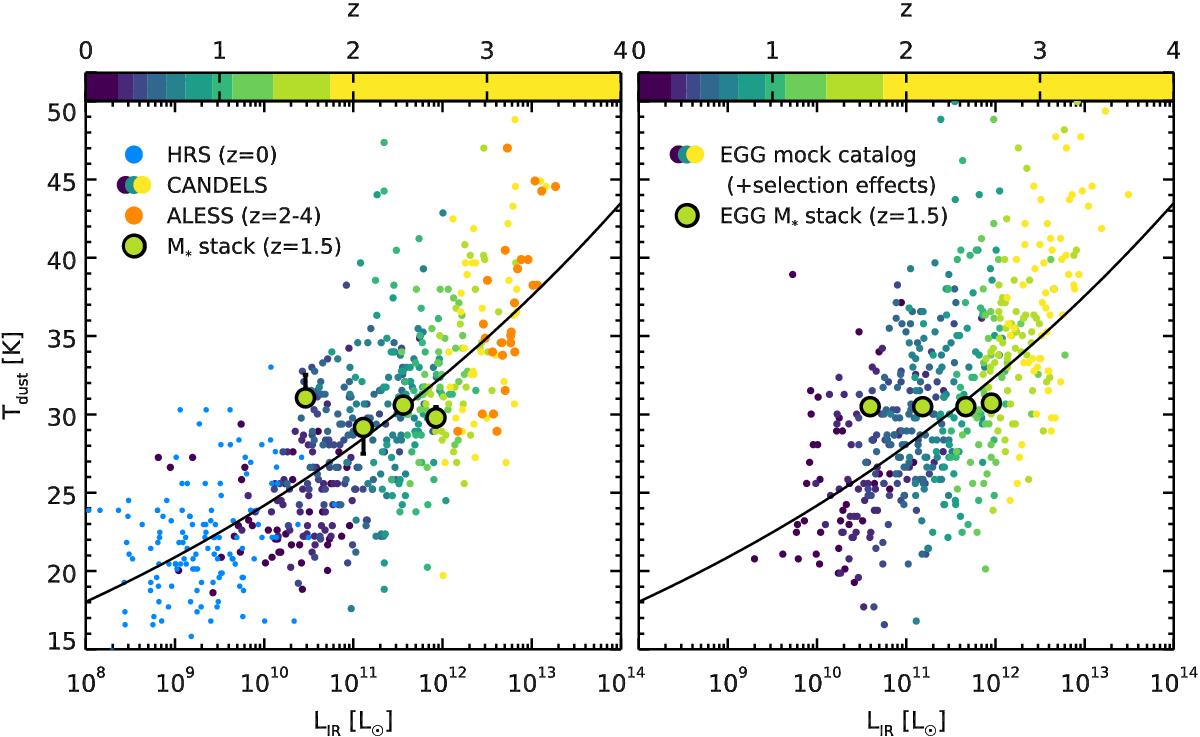
Left: relation between the dust temperature (Tdust) and the total infrared luminosity (LIR) for galaxies individually detected with Herschel in the CANDELS fields (colored circles, dark purple to yellow from low to high redshift), from ALESS (orange circles) and the HRS (light blue circles). We overplot the best-fit power law (see text) with a black solid line, as well as the values obtained at z = 1.5 by stacking galaxies in different bins of mass (see Sect. 4.1). Right: same as left, but for the mock CANDELS catalog produced with EGG (defined in Sect. 4.2.2).
Current usage metrics show cumulative count of Article Views (full-text article views including HTML views, PDF and ePub downloads, according to the available data) and Abstracts Views on Vision4Press platform.
Data correspond to usage on the plateform after 2015. The current usage metrics is available 48-96 hours after online publication and is updated daily on week days.
Initial download of the metrics may take a while.