Fig. 1
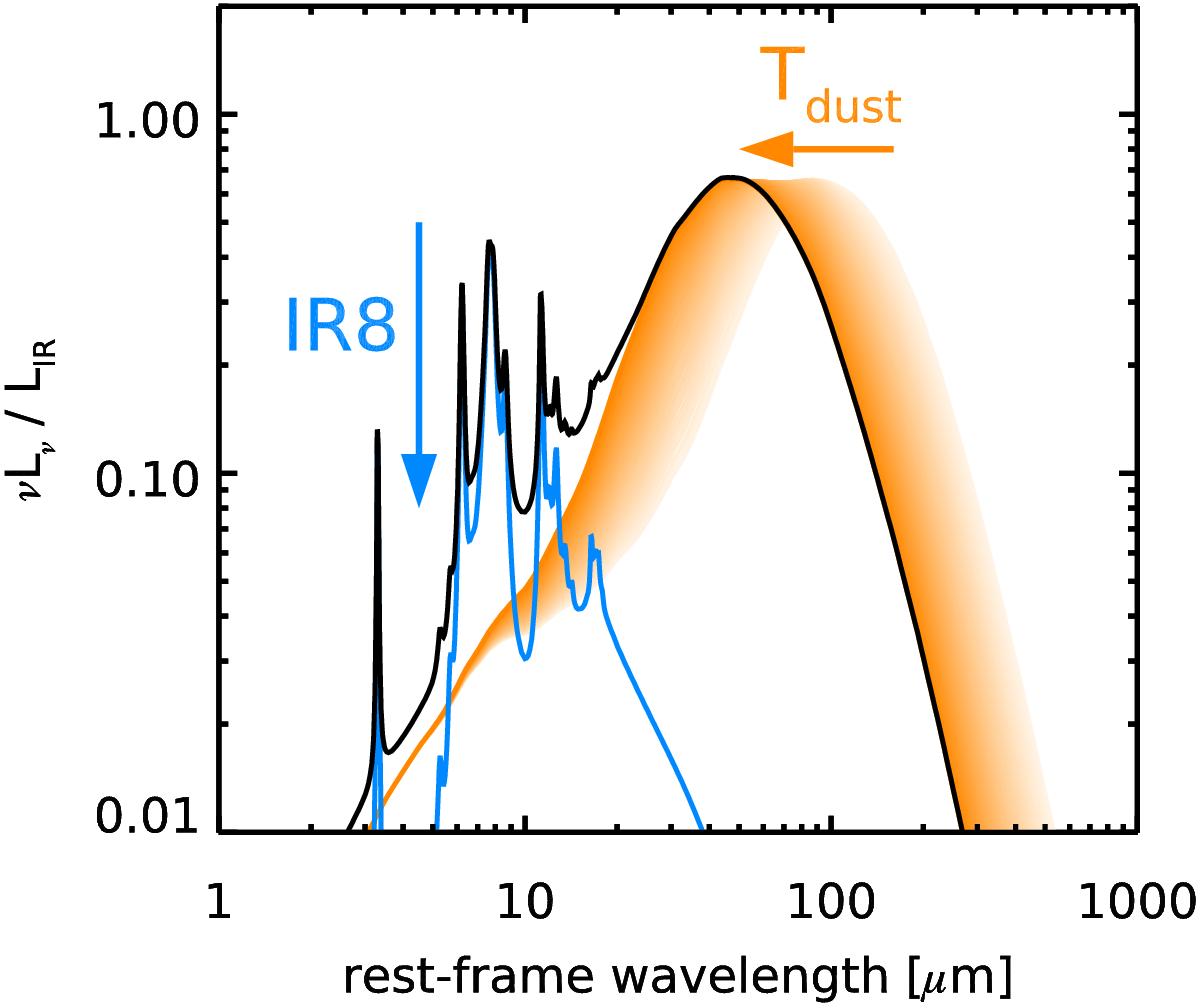
Cartoon picture illustrating the two effective parameters impacting the shape of our FIR SEDs. The total SED, normalized to unit LIR, is shown with a black solid line, while the dust continuum and PAH components are shown with solid orange and blue lines, respectively. We also show how the shape of the SED varies with dust temperature Tdust by displaying several templates of different Tdust in orange lines of varying intensities. The orange and blue arrows illustrate how the SED is modified by increasing Tdust and IR8, respectively.
Current usage metrics show cumulative count of Article Views (full-text article views including HTML views, PDF and ePub downloads, according to the available data) and Abstracts Views on Vision4Press platform.
Data correspond to usage on the plateform after 2015. The current usage metrics is available 48-96 hours after online publication and is updated daily on week days.
Initial download of the metrics may take a while.