Fig. 1
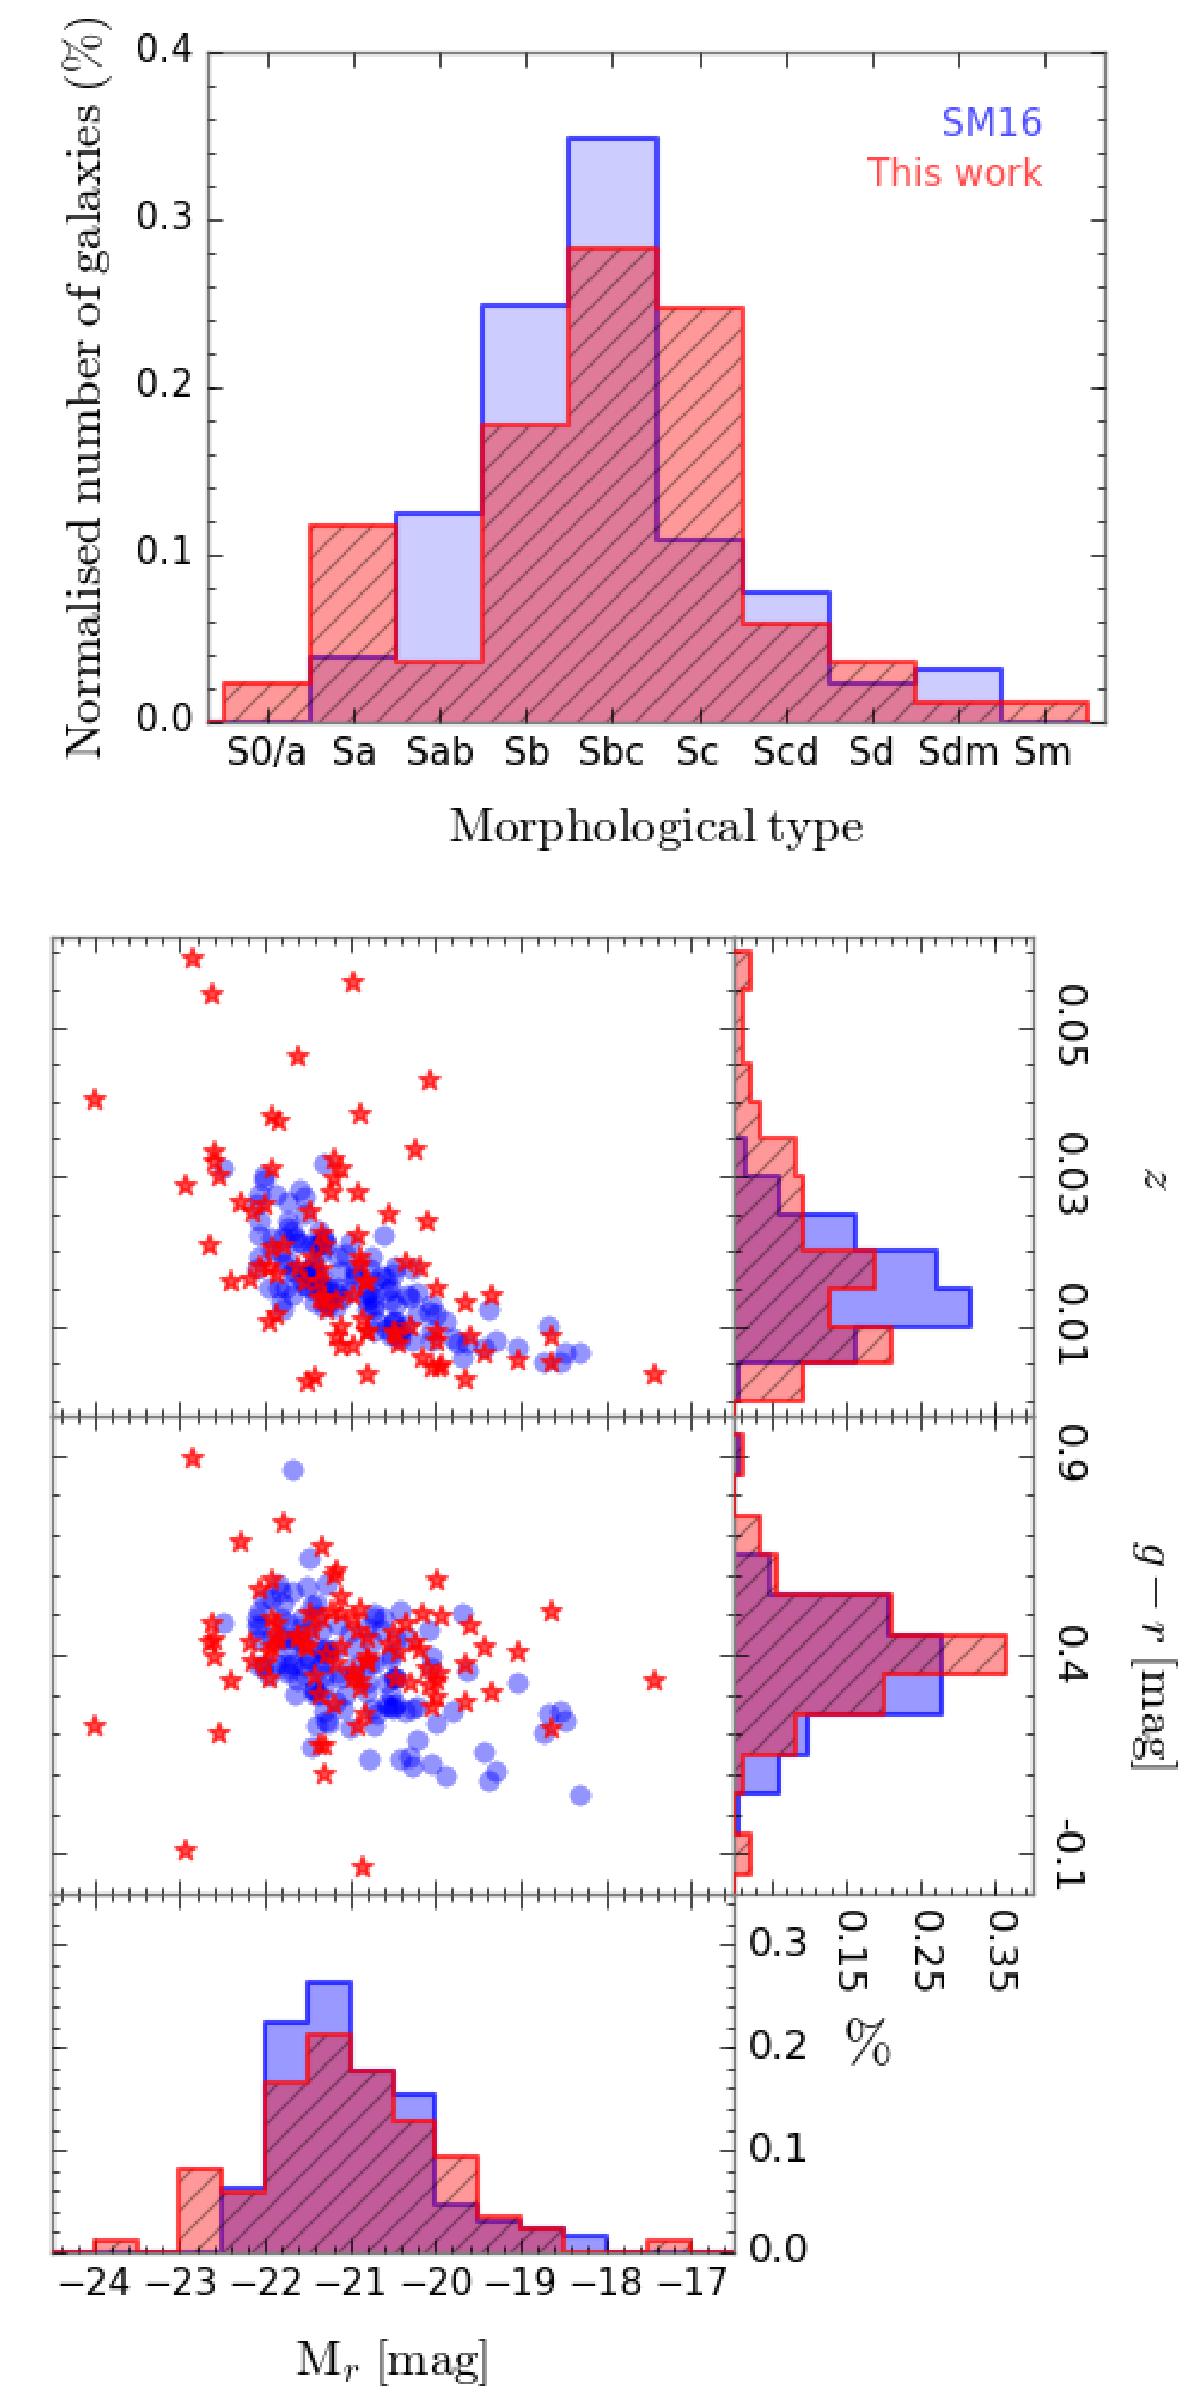
Characterisation of the analysed sample (red dashed histograms and stars) as compared with the one used in Sánchez-Menguiano et al. (2016b, blue solid histograms and circles). The plot shows the distribution of morphological types (top), and the redshift and g−r colour distributions as a function of the absolute r-band magnitudes (bottom). The frequency histograms for these three parameters are also shown.
Current usage metrics show cumulative count of Article Views (full-text article views including HTML views, PDF and ePub downloads, according to the available data) and Abstracts Views on Vision4Press platform.
Data correspond to usage on the plateform after 2015. The current usage metrics is available 48-96 hours after online publication and is updated daily on week days.
Initial download of the metrics may take a while.