Fig. 4
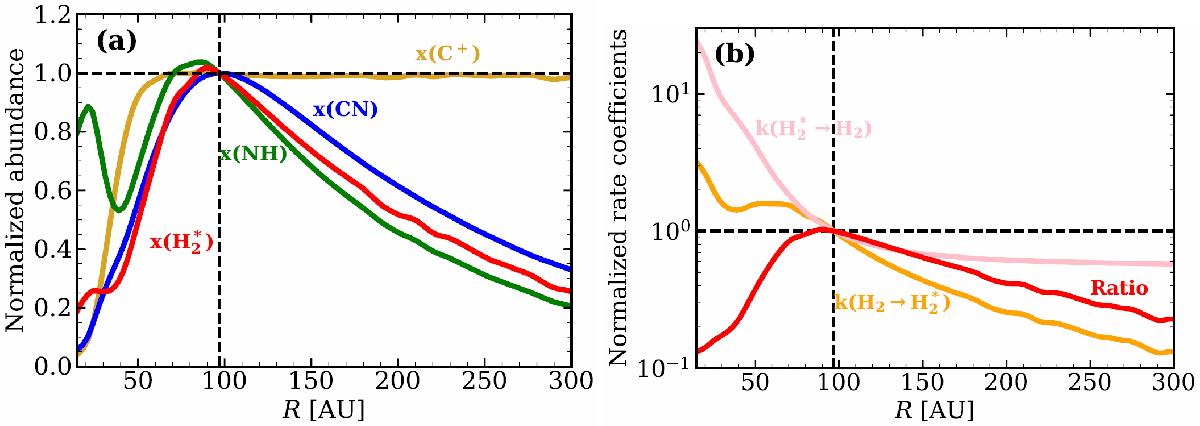
Panel a: radial abundances for the most important reactants in the formation of CN (see reactions (4)and (5)), along the dotted green line in Fig. 2a. Each curve is normalized to 1 at the location of the CN maximum. Panel b: H2 excitation rate, H![]() de-excitation rate and their ratio along the dotted green line in Fig. 2a. All quantities are normalized to their value at the CN peak abundance (green dot in Fig. 2a) and refer to the model shown in Fig. 2a. The dashed vertical line indicates the location of the CN peak abundance.
de-excitation rate and their ratio along the dotted green line in Fig. 2a. All quantities are normalized to their value at the CN peak abundance (green dot in Fig. 2a) and refer to the model shown in Fig. 2a. The dashed vertical line indicates the location of the CN peak abundance.
Current usage metrics show cumulative count of Article Views (full-text article views including HTML views, PDF and ePub downloads, according to the available data) and Abstracts Views on Vision4Press platform.
Data correspond to usage on the plateform after 2015. The current usage metrics is available 48-96 hours after online publication and is updated daily on week days.
Initial download of the metrics may take a while.