Fig. 2
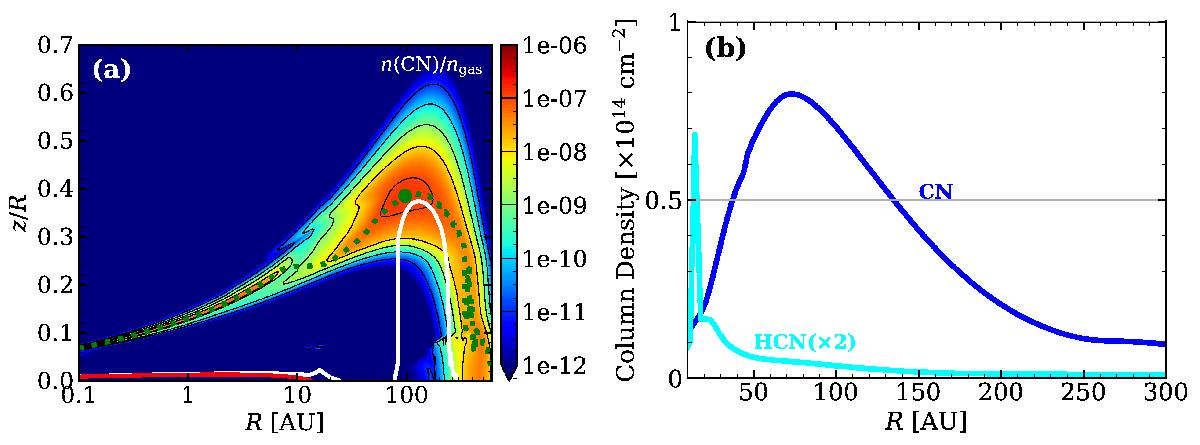
Panel a: abundance of CN in a 10-2M⊙, ψ = 0.3, hc = 0.1 disk surrounding a T Tauri star. The location of the peak value is indicated with the green dot. The shape of the distribution of the outer high-CN-abundance region is representative for all the other models. The white line shows the τ = 0.5 contour of the CN (N = 3−2) emission line. The red line shows the dust τ = 1 layer at the same wavelength. The green dotted line indicates the location of the vertical CN abundance maximum for each radius. Panel b: CN (solid blue line) and HCN (cyan line) column densities calculated for the same model, plotted on a linear rather than logarithmic scale. The HCN column density was multiplied by 2 and is more radially concentrated than CN.
Current usage metrics show cumulative count of Article Views (full-text article views including HTML views, PDF and ePub downloads, according to the available data) and Abstracts Views on Vision4Press platform.
Data correspond to usage on the plateform after 2015. The current usage metrics is available 48-96 hours after online publication and is updated daily on week days.
Initial download of the metrics may take a while.