Fig. C.1
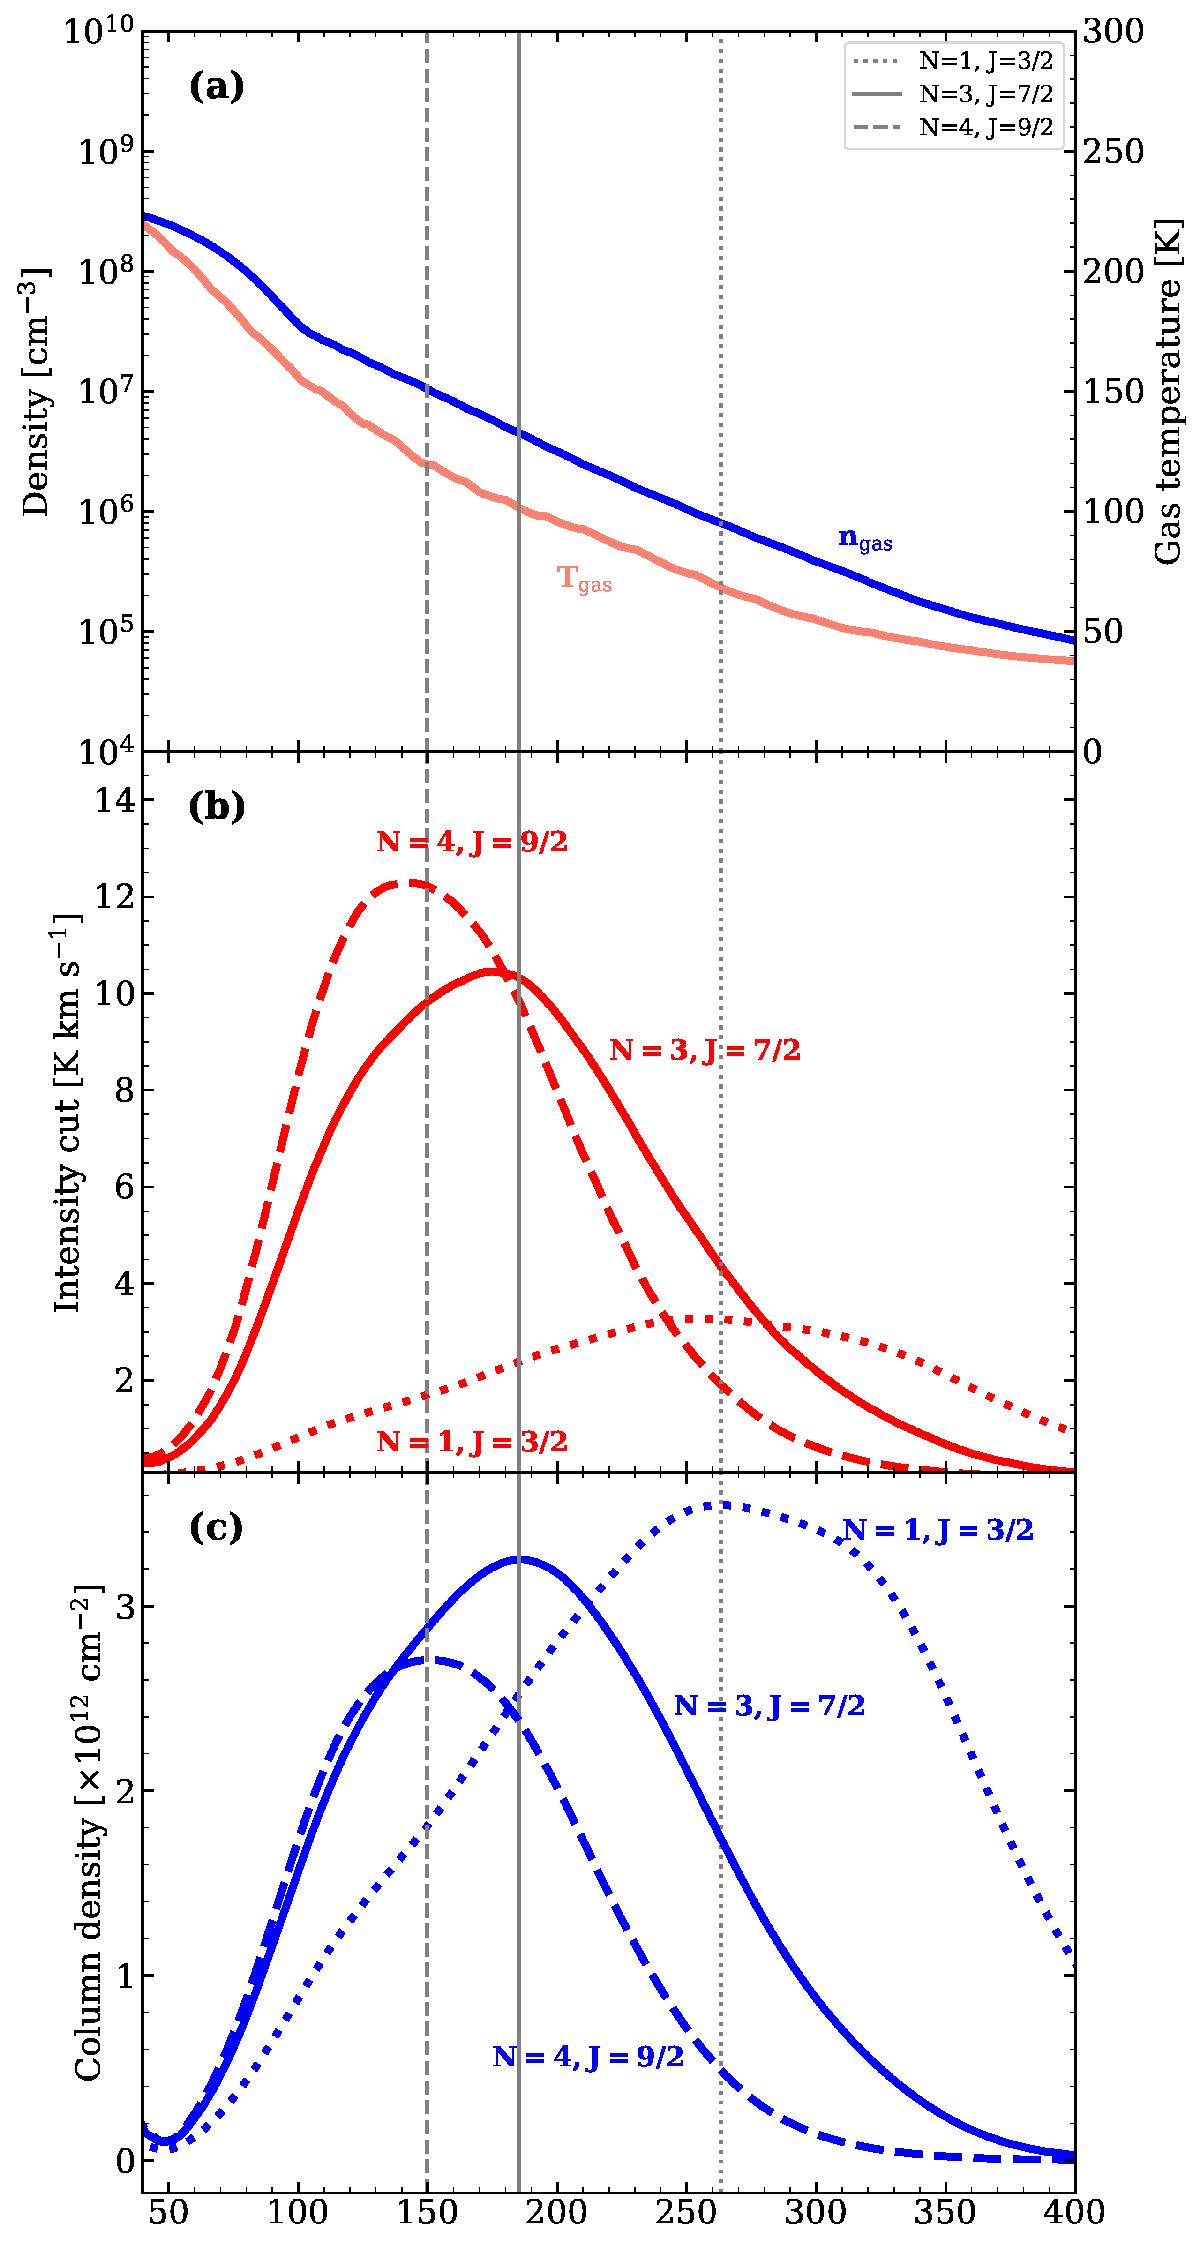
Panel a: gas density and temperature along the CN high abundance layer (dotted-green line in Fig. 2a). Panel c: column densities of CN molecules in the (N = 1, J = 3/2) (dotted), (N = 3, J = 7/2) (solid) and (N = 5, J = 11/2) (dashed) levels. Panel b: intensities of the N = 5−4, N = 3−2, and N = 2−1 transitions, for comparison with panel c. The vertical lines mark the location of the column density peaks of CN molecules in the three levels.
Current usage metrics show cumulative count of Article Views (full-text article views including HTML views, PDF and ePub downloads, according to the available data) and Abstracts Views on Vision4Press platform.
Data correspond to usage on the plateform after 2015. The current usage metrics is available 48-96 hours after online publication and is updated daily on week days.
Initial download of the metrics may take a while.