Free Access
Fig. A.2
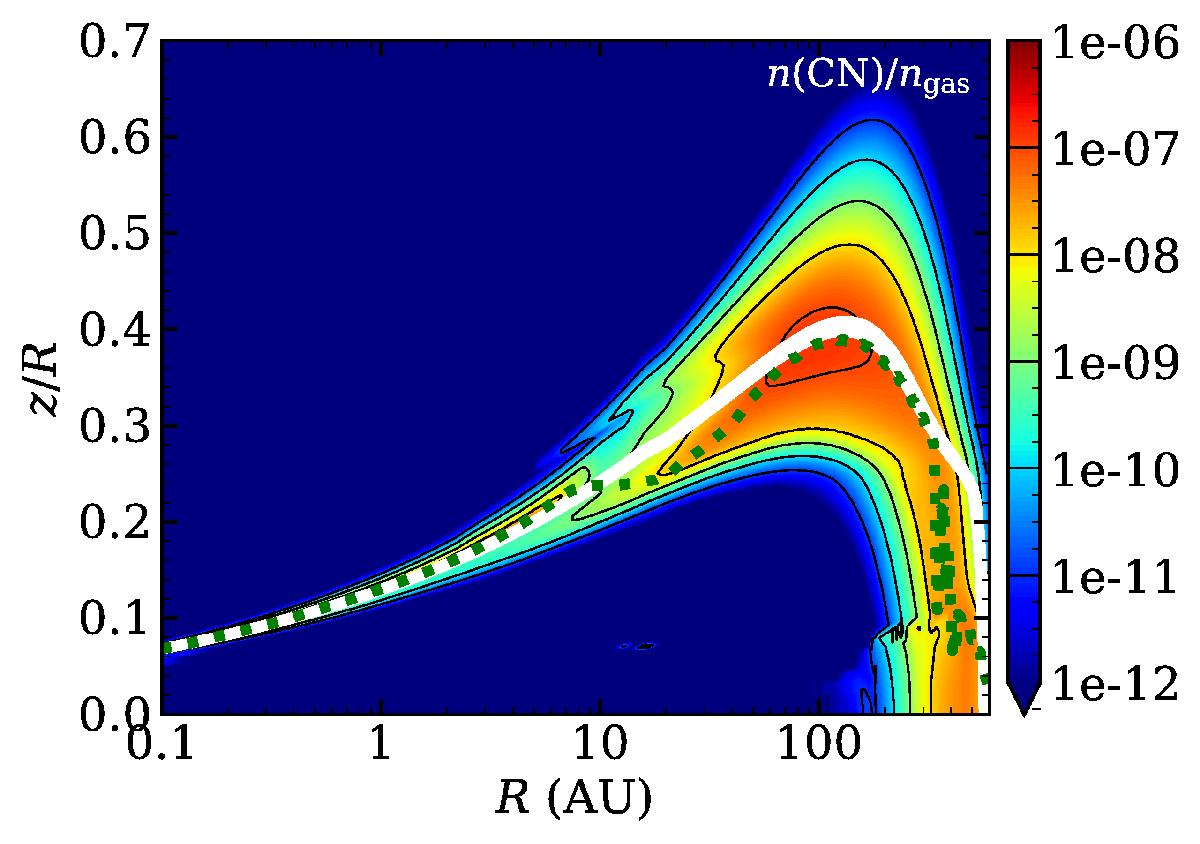
Overlay of the CN abundance structure in a 10-2M⊙, ψ = 0.3, hc = 0.1 disk surrounding a T Tauri star with a green dotted line indicating the location of the vertical CN abundance maximum for each radius. The white line highlights a surface of constant G0/ngas. The two lines follow each other very closely.
Current usage metrics show cumulative count of Article Views (full-text article views including HTML views, PDF and ePub downloads, according to the available data) and Abstracts Views on Vision4Press platform.
Data correspond to usage on the plateform after 2015. The current usage metrics is available 48-96 hours after online publication and is updated daily on week days.
Initial download of the metrics may take a while.