Fig. 14
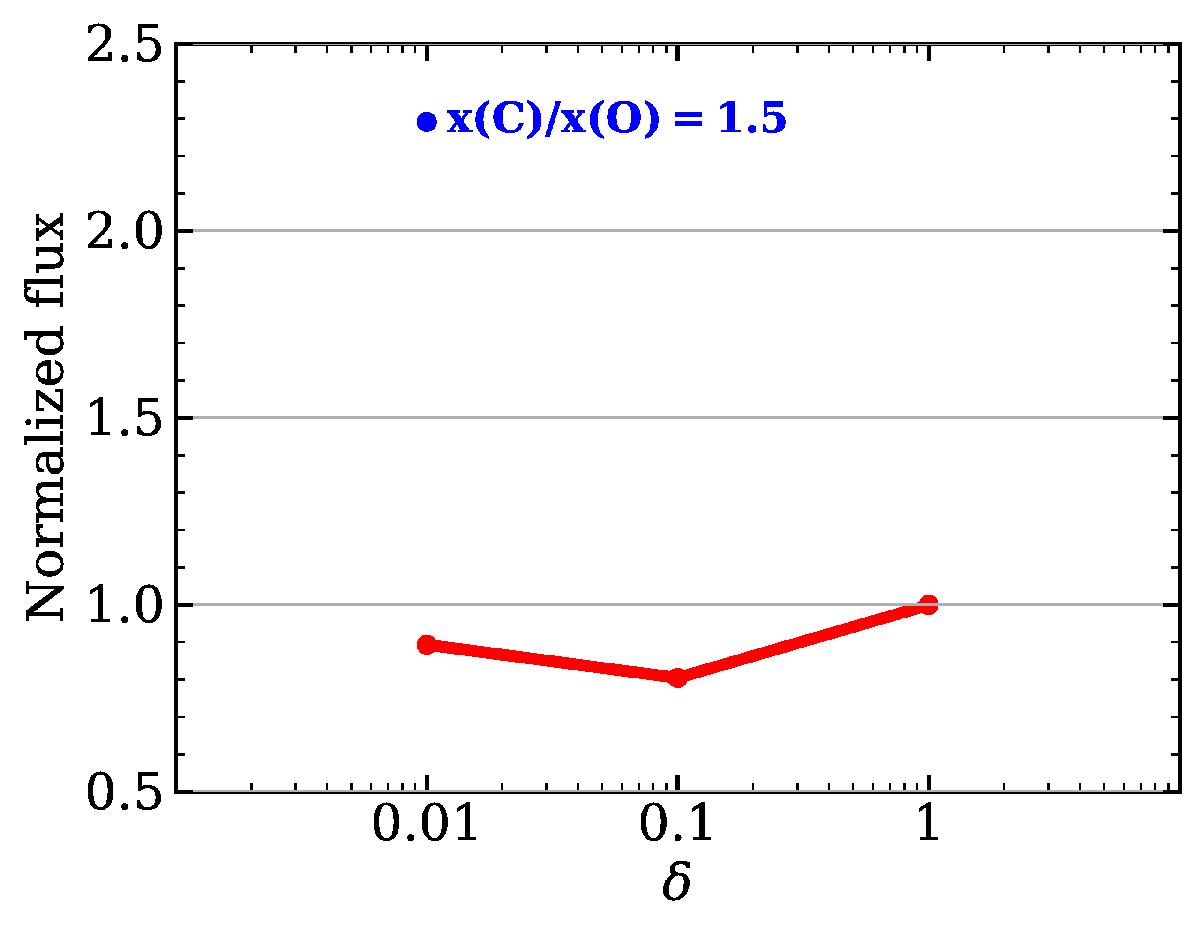
Integrated flux of the CN (N,J) = (3−2, 7/2−5/2) emission in a disk with Mgas = 10-2M⊙, ψ = 0.2, and hc = 0.1 as a function of the C and O depletion. The blue dot refers to the model where a higher gas-phase carbon abundance than oxygen is assumed. All the fluxes are normalized to the non-carbon-depleted δ = 1 case. The fluxes vary by less than a factor of 2.
Current usage metrics show cumulative count of Article Views (full-text article views including HTML views, PDF and ePub downloads, according to the available data) and Abstracts Views on Vision4Press platform.
Data correspond to usage on the plateform after 2015. The current usage metrics is available 48-96 hours after online publication and is updated daily on week days.
Initial download of the metrics may take a while.