Press Release
Free Access
Fig. 9
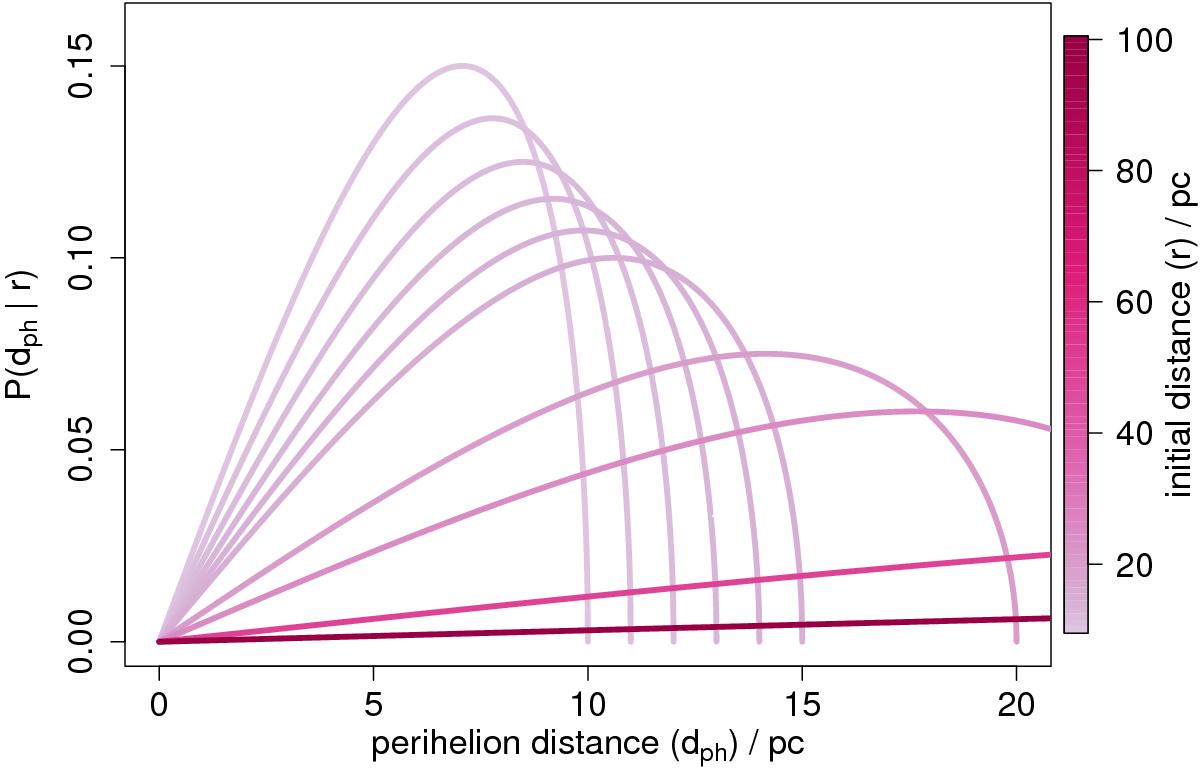
PDF over the perihelion distance for stars with different initial distances r = 10,11,12,13,14,15,20,25,50,100 pc, shown in different colours, as described by the model (Sect. 4.1). The lines for r> 20 pc extend beyond the right boundary of the plot, but have the same shape, dropping to zero at dph = r.
Current usage metrics show cumulative count of Article Views (full-text article views including HTML views, PDF and ePub downloads, according to the available data) and Abstracts Views on Vision4Press platform.
Data correspond to usage on the plateform after 2015. The current usage metrics is available 48-96 hours after online publication and is updated daily on week days.
Initial download of the metrics may take a while.