Fig. 7
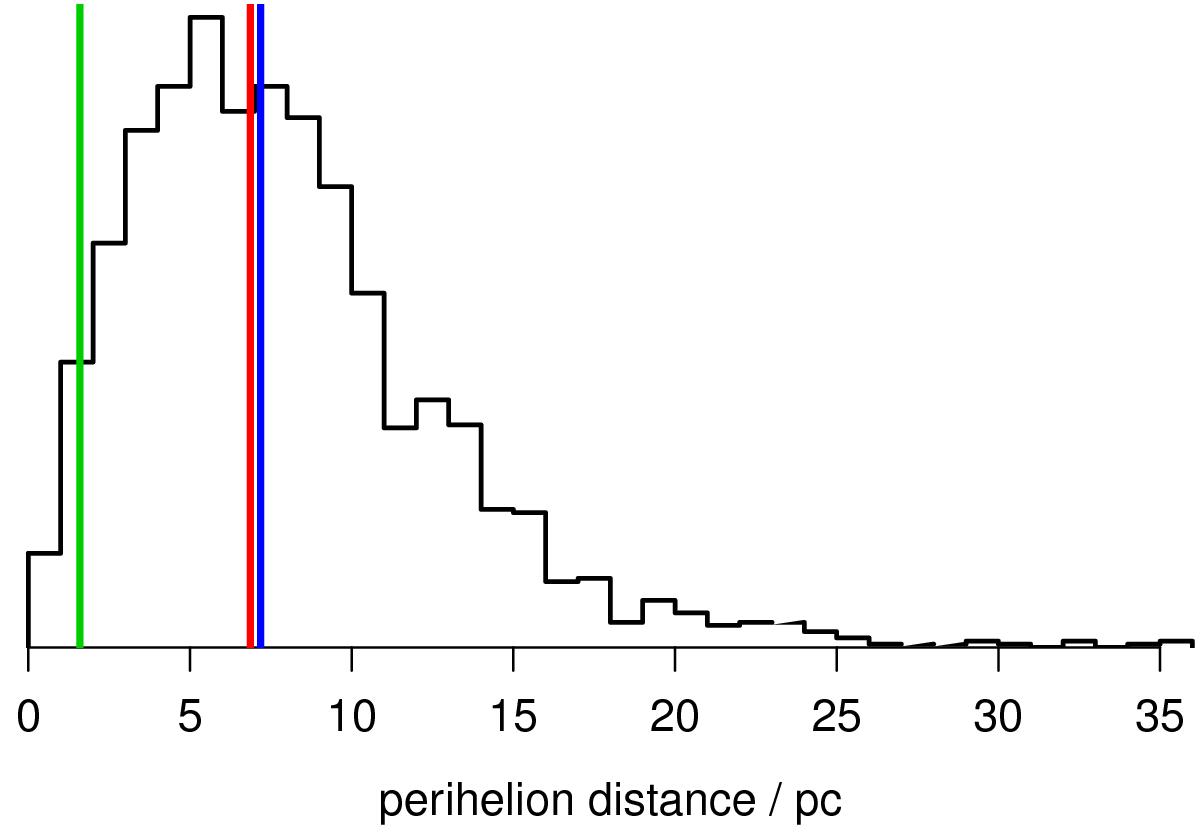
Distribution of the perihelion distance (from the orbital integration of the 2000 surrogates) for Tyc 6528-980-1. The green, red, and blue lines (left to right) show the nominal, LMA, and median estimates. This demonstrates that the nominal estimate – from integrating the orbit of just the nominal data – can be very unrepresentative of the distribution we get when we account for the uncertainties in the data.
Current usage metrics show cumulative count of Article Views (full-text article views including HTML views, PDF and ePub downloads, according to the available data) and Abstracts Views on Vision4Press platform.
Data correspond to usage on the plateform after 2015. The current usage metrics is available 48-96 hours after online publication and is updated daily on week days.
Initial download of the metrics may take a while.