Press Release
Free Access
Fig. 2
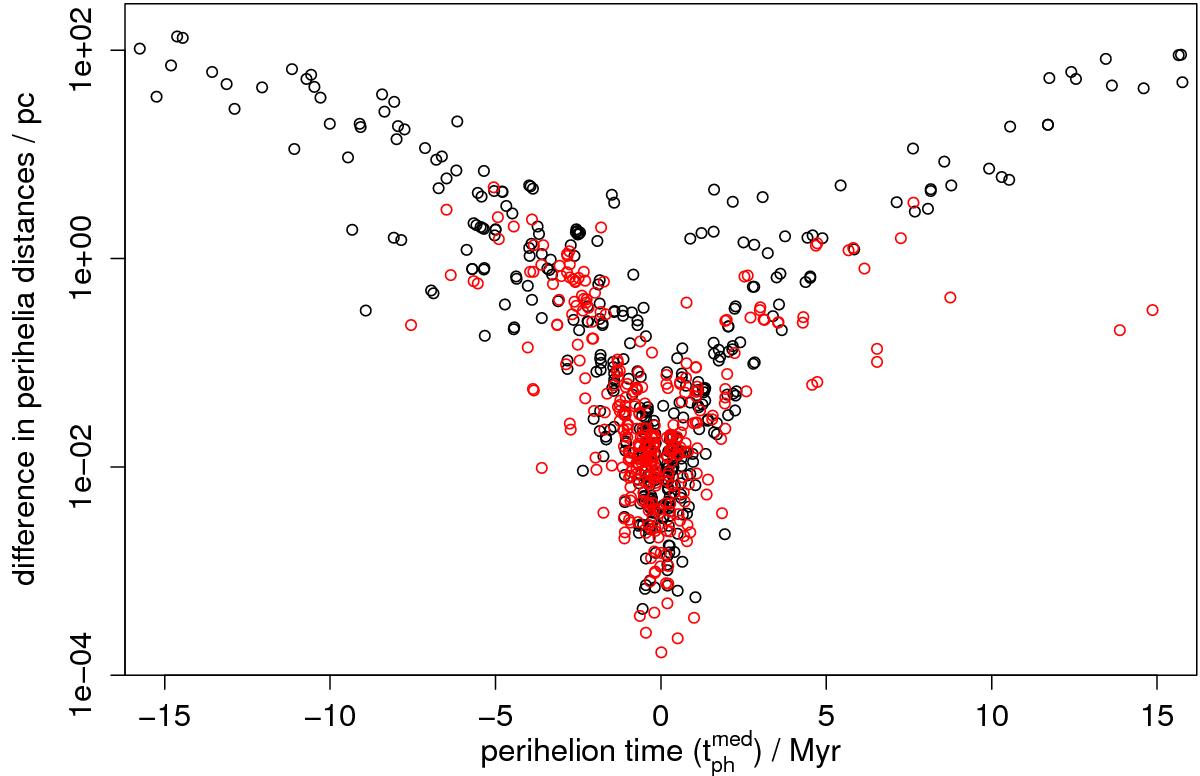
Difference between perihelion estimates from orbit integration of surrogates (![]() ) and the linear motion approximation (
) and the linear motion approximation (![]() ), on a log scale. The black symbols are for
), on a log scale. The black symbols are for ![]() , the red symbols for
, the red symbols for ![]() . The set of objects is the same as shown in Fig. 1, but excluding, for plotting purposes, the three points with
. The set of objects is the same as shown in Fig. 1, but excluding, for plotting purposes, the three points with ![]() Myr.
Myr.
Current usage metrics show cumulative count of Article Views (full-text article views including HTML views, PDF and ePub downloads, according to the available data) and Abstracts Views on Vision4Press platform.
Data correspond to usage on the plateform after 2015. The current usage metrics is available 48-96 hours after online publication and is updated daily on week days.
Initial download of the metrics may take a while.