Fig. 11
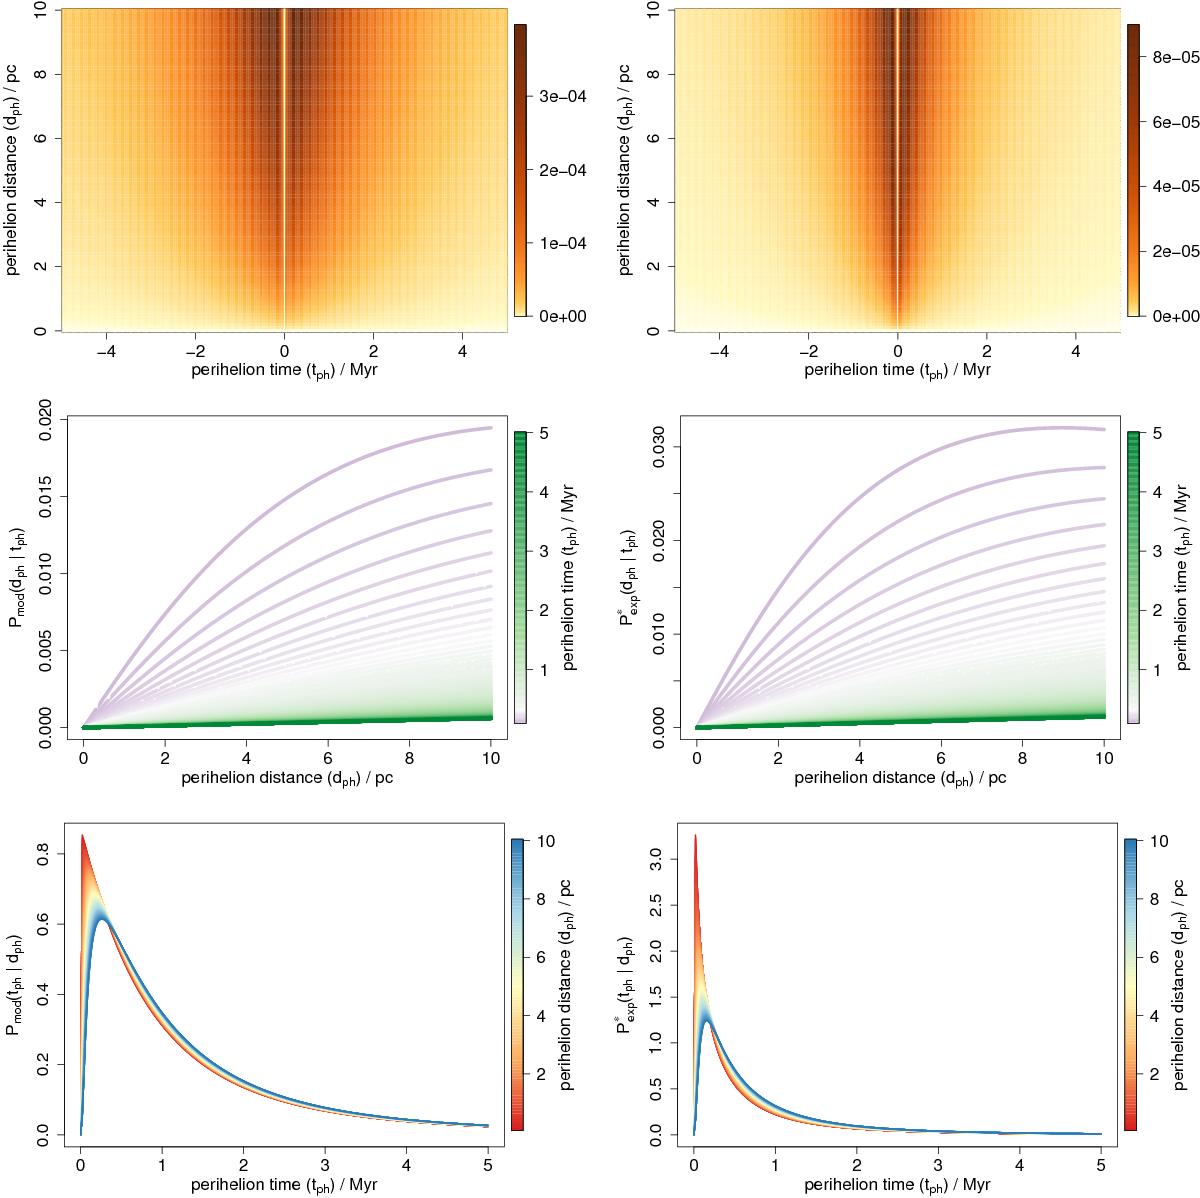
Distribution of stellar encounters in the model (left column of plots) and what we expect to observe from this model given the selection function (right column). Top row of plots: two-dimensional PDFs Pmod(tph,dph) (left) and ![]() (right) on a colour scale in units Myr-1 pc-1. The colour scale covers the full range of densities plotted (and is different in the two cases, being a factor of 4.4 larger for the model). Middle row: one-dimensional conditional PDFs over perihelion distance for different values of tph ranging from 100 kyr to 5 Myr in steps of 20 kyr. These are vertical cuts through the two-dimensional PDF (and re-normalized, as given by Eq. (17) for the model distribution). Bottom row: one-dimensional conditional PDFs over perihelion time for different values of dph ranging from 0.1 pc to 10 pc in steps of 0.1 pc. Only the positive perihelion times are shown for the four conditional plots, which also use different density scales (vertical axes).
(right) on a colour scale in units Myr-1 pc-1. The colour scale covers the full range of densities plotted (and is different in the two cases, being a factor of 4.4 larger for the model). Middle row: one-dimensional conditional PDFs over perihelion distance for different values of tph ranging from 100 kyr to 5 Myr in steps of 20 kyr. These are vertical cuts through the two-dimensional PDF (and re-normalized, as given by Eq. (17) for the model distribution). Bottom row: one-dimensional conditional PDFs over perihelion time for different values of dph ranging from 0.1 pc to 10 pc in steps of 0.1 pc. Only the positive perihelion times are shown for the four conditional plots, which also use different density scales (vertical axes).
Current usage metrics show cumulative count of Article Views (full-text article views including HTML views, PDF and ePub downloads, according to the available data) and Abstracts Views on Vision4Press platform.
Data correspond to usage on the plateform after 2015. The current usage metrics is available 48-96 hours after online publication and is updated daily on week days.
Initial download of the metrics may take a while.