Fig. 10
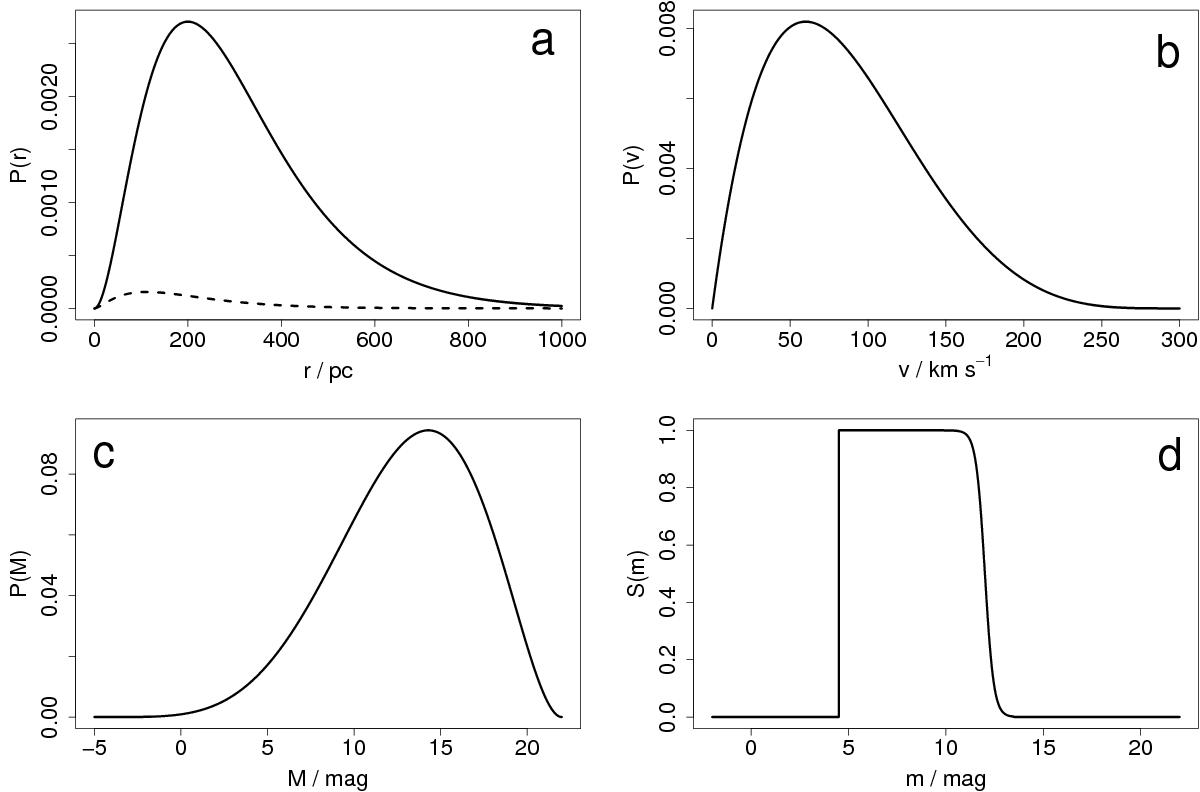
Input distributions for the completeness model are the a) distance (solid line), b) space velocity, c) absolute magnitude (normalized PDFs). The selection function (on apparent magnitude) is shown in panel d. This modifies the model distance distribution to become the expected distribution shown as the dashed line in panel a.
Current usage metrics show cumulative count of Article Views (full-text article views including HTML views, PDF and ePub downloads, according to the available data) and Abstracts Views on Vision4Press platform.
Data correspond to usage on the plateform after 2015. The current usage metrics is available 48-96 hours after online publication and is updated daily on week days.
Initial download of the metrics may take a while.