Fig. 1
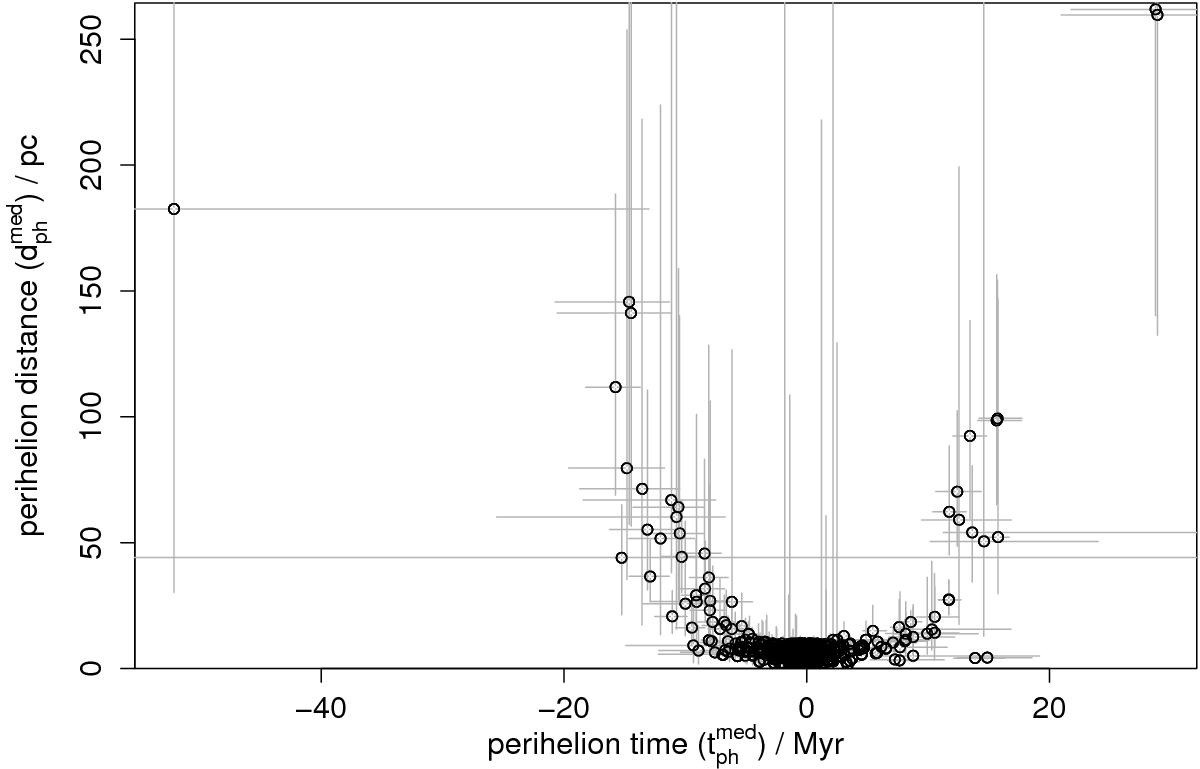
Perihelion times and distances computed by orbit integration for all 725 objects. Open circles show the median of the perihelion time and distance distributions. The error bars show the limits of the 5% and 95% percentiles (which together form an asymmetric 90% confidence interval). Note that this set of objects includes duplicates (see Table 2).
Current usage metrics show cumulative count of Article Views (full-text article views including HTML views, PDF and ePub downloads, according to the available data) and Abstracts Views on Vision4Press platform.
Data correspond to usage on the plateform after 2015. The current usage metrics is available 48-96 hours after online publication and is updated daily on week days.
Initial download of the metrics may take a while.