Fig. 8
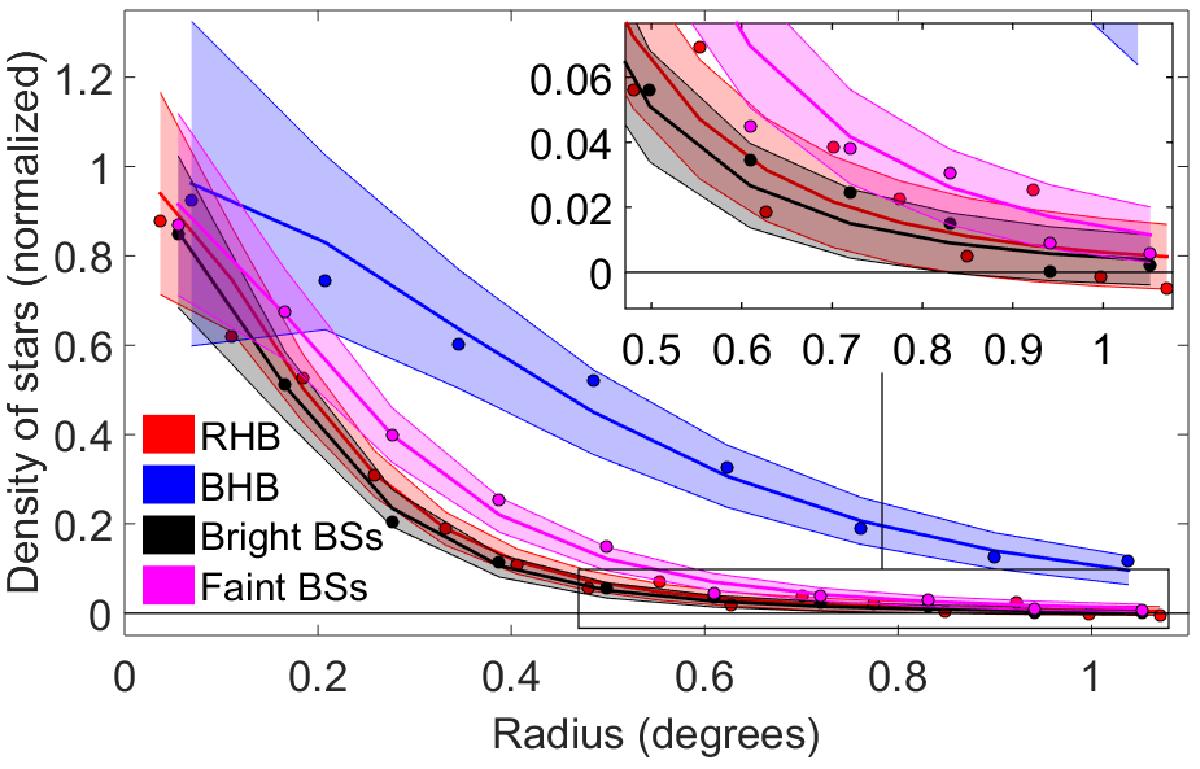
Observed surface density profiles (normalized and contamination subtracted) of RHB, BHB and BSs evolutionary phases as a function of the major axis radius (with the external parts zoomed in). The colour bands show the 1σ confidence intervals of the best-fitting Plummer profiles obtained with the MCMC Hammer. 1σ confidence intervals are computed from the fitted models assuming Poisson variances in each elliptical annulus.
Current usage metrics show cumulative count of Article Views (full-text article views including HTML views, PDF and ePub downloads, according to the available data) and Abstracts Views on Vision4Press platform.
Data correspond to usage on the plateform after 2015. The current usage metrics is available 48-96 hours after online publication and is updated daily on week days.
Initial download of the metrics may take a while.