Fig. 7

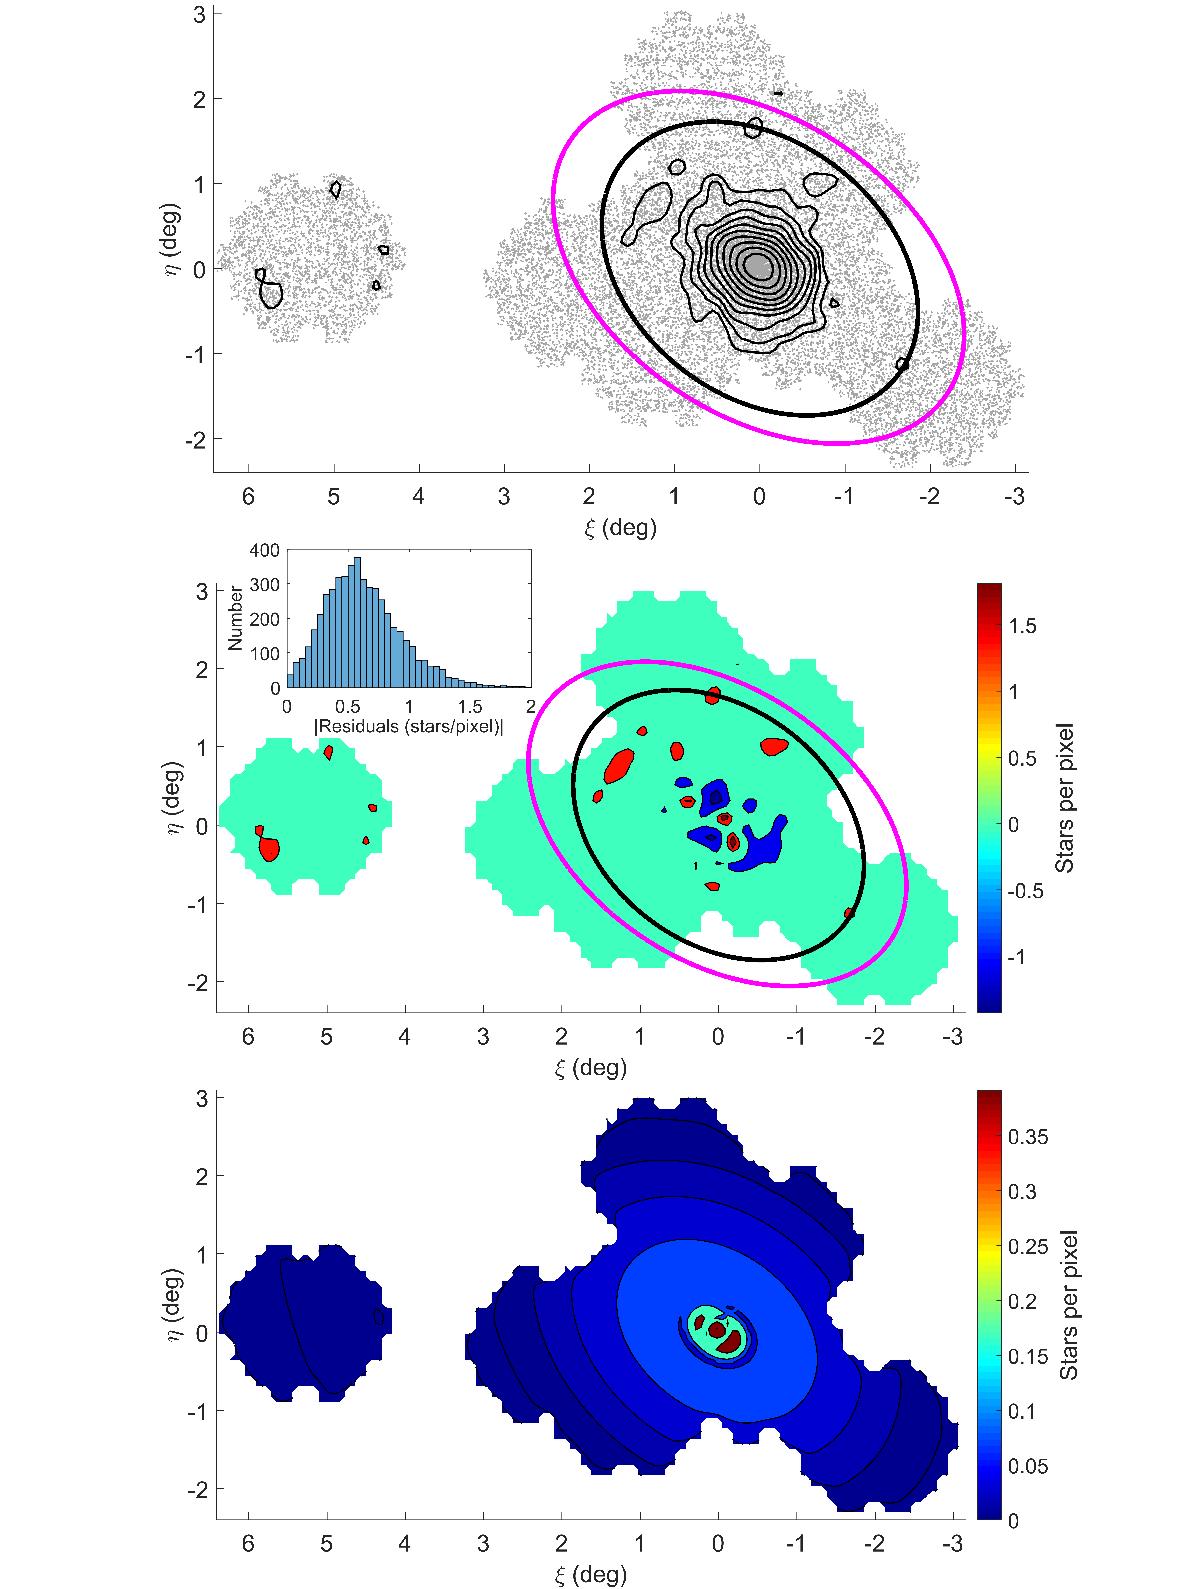
Top: spatial distribution of stars along the line-of-sight to the Sextans dSph, with overlaid iso-density contours from the MFM surface number density map. The pink and black ellipses show the nominal King tidal radius with parameters from IH95 and this work, respectively. The contours denote exponentially increasing values of surface number density, with the lowest one indicating a 2σ detection; the 3σ level is approximately the second contour. Middle: map of residuals between Sextans surface number density map from the MFM analysis and the mean surface density given by the best-fitting King, Sersic, Plummer and Exponential profiles (for the parameters see Table 3), at 2σ and 3σ detections above and below the mean. The inset shows the frequency distribution of the residuals. Bottom: standard deviation of residuals between the different fitted profiles; this shows the regions where the residuals depend on a given profile to a greater extent. It can be seen that the over- and under-densities hardly depend on the fitted profile, since their surface densities are considerably larger than the scatter between the different profiles.
Current usage metrics show cumulative count of Article Views (full-text article views including HTML views, PDF and ePub downloads, according to the available data) and Abstracts Views on Vision4Press platform.
Data correspond to usage on the plateform after 2015. The current usage metrics is available 48-96 hours after online publication and is updated daily on week days.
Initial download of the metrics may take a while.


