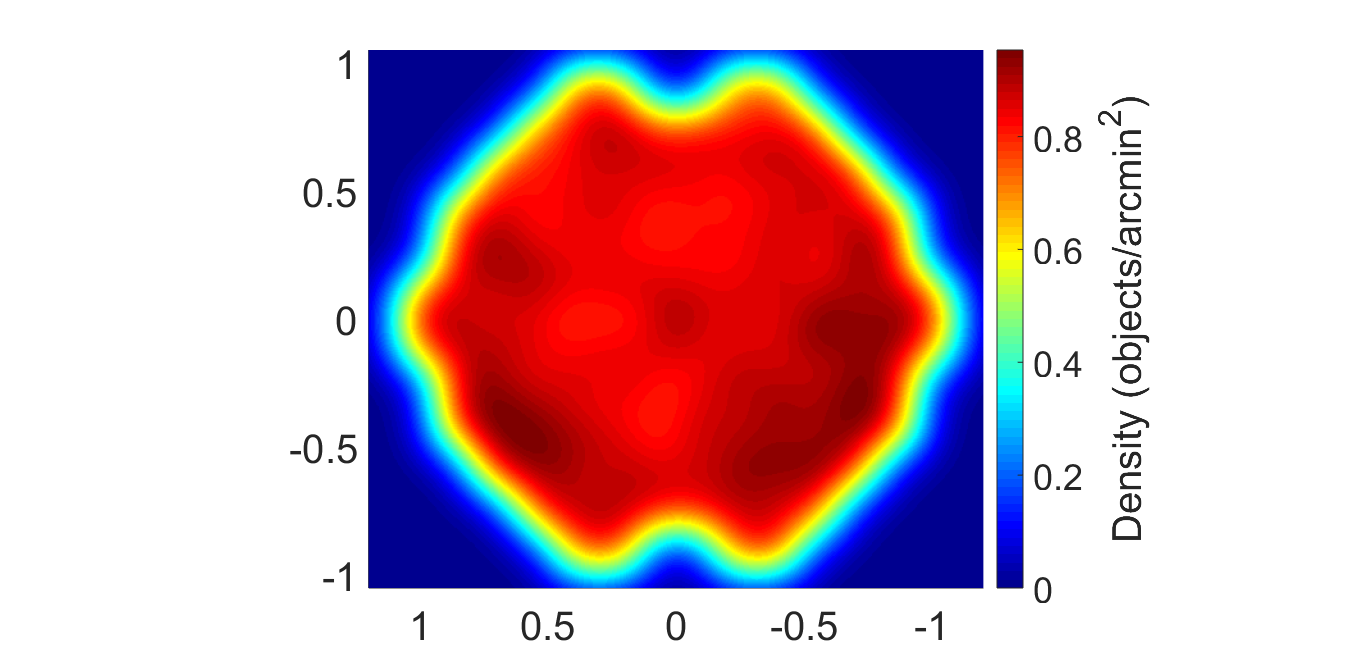
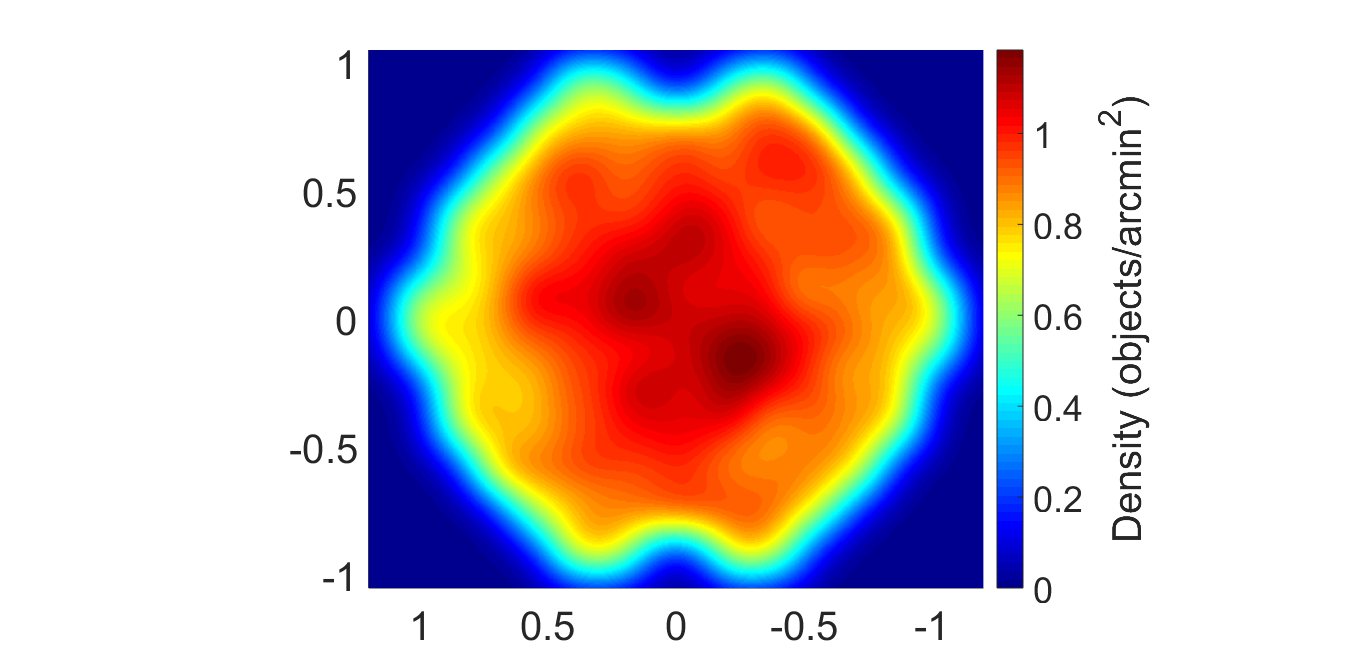
Fig. A.1
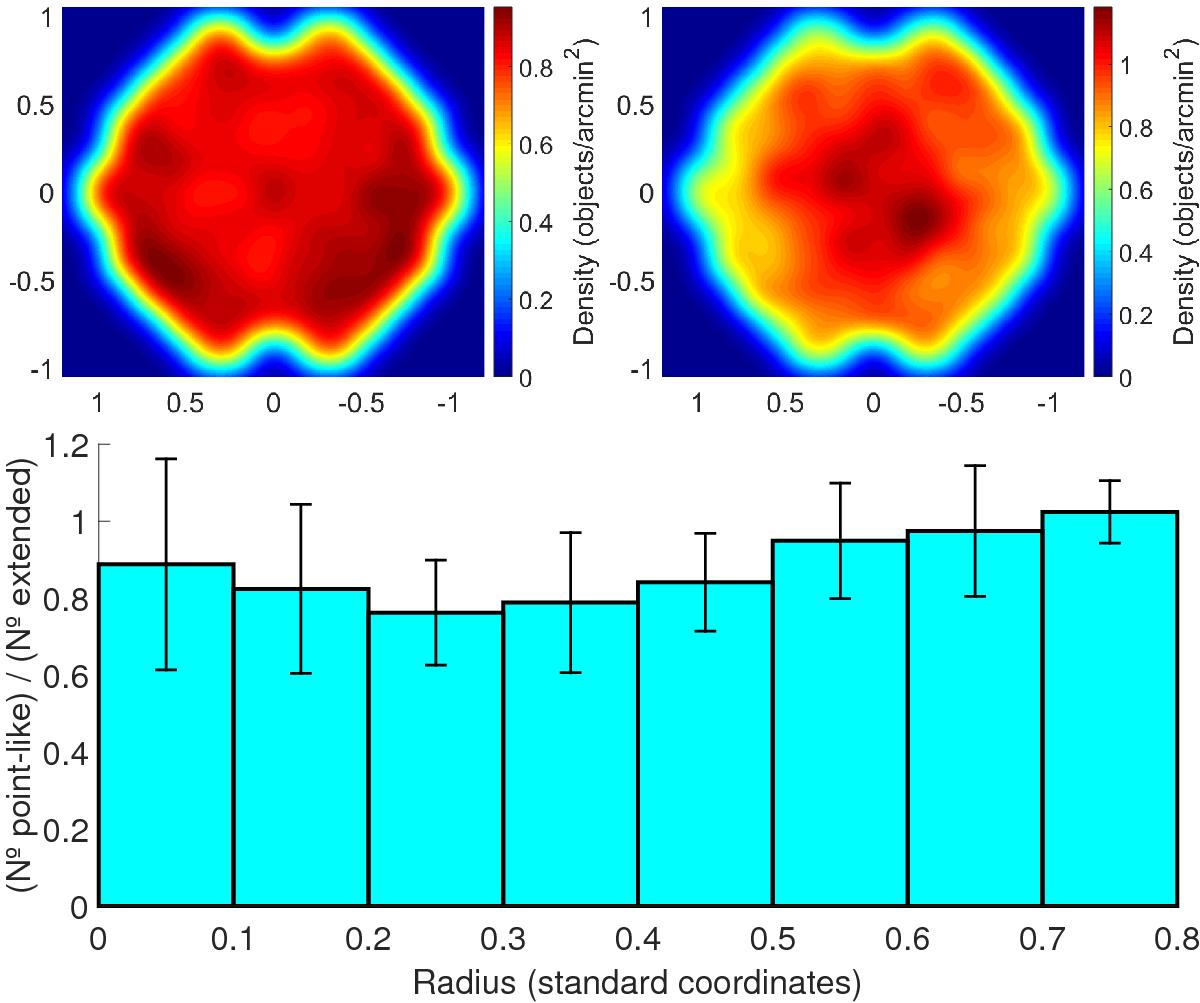
Smoothed map of the mean density pattern for point-like (top-left) and extended (top-right) objects with 1.1 <g−r< 1.6 in standard coordinates, discarding 3σ outliers, with σ being the standard deviation between the different pointings. The bottom panel plots the ratio of point-like/extended objects, showing the spatial gradient in the morphological misclassification when moving away from the centre of the pointings. The error-bars indicate the standard deviation of the ratios derived from the different measurements in all the pointings.
Current usage metrics show cumulative count of Article Views (full-text article views including HTML views, PDF and ePub downloads, according to the available data) and Abstracts Views on Vision4Press platform.
Data correspond to usage on the plateform after 2015. The current usage metrics is available 48-96 hours after online publication and is updated daily on week days.
Initial download of the metrics may take a while.