Fig. 10
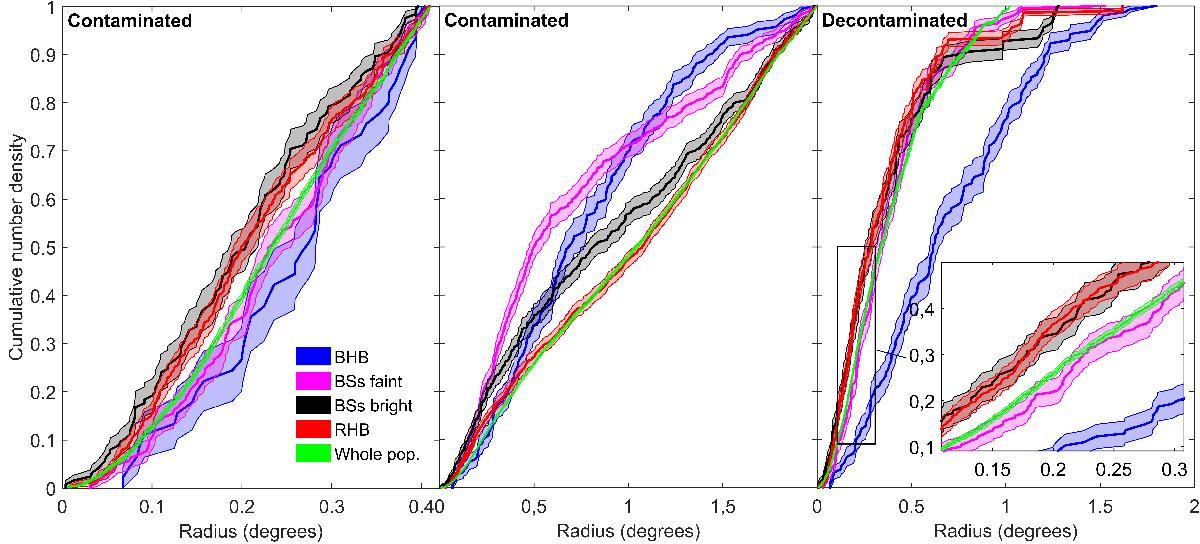
Radial CDFs of the evolutionary phases studied in Sect. 5 and the whole population of Sextans. The colour bands show the 1σ confidence intervals. Left: within the major axis radius reached by Lee et al. (2003). Although this plot is contaminated, the decontaminated version is rather similar, as it does not reach the external regions of Sextans where the impact of contaminants is higher. Middle: within the tidal radius derived in this work, with contaminants included. Right: within the tidal radius derived in this work, with contaminants extracted and an inset magnifying the internal region where all evolutionary phases are better separated.
Current usage metrics show cumulative count of Article Views (full-text article views including HTML views, PDF and ePub downloads, according to the available data) and Abstracts Views on Vision4Press platform.
Data correspond to usage on the plateform after 2015. The current usage metrics is available 48-96 hours after online publication and is updated daily on week days.
Initial download of the metrics may take a while.