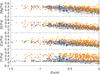
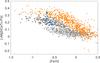
Fig. 4

Abundance ratios of the α-elements. Our stars are shown as blue symbols. Orange dots denote bulge stars from Gonzalez et al. (2011), Bensby et al. (2013), Johnson et al. (2014), while disk stars are depicted as gray points (Reddy et al. 2003, 2006; Bensby et al. 2014). Here, we specifically distinguish between thin (light gray) and thick disk stars (dark gray). The bottom panel shows the straight average of the Mg, Si, Ca, and Ti abundances as a proxy for α-enhancement. In all panels, the axis have been truncated to highlight the abundance region of our targets.
Current usage metrics show cumulative count of Article Views (full-text article views including HTML views, PDF and ePub downloads, according to the available data) and Abstracts Views on Vision4Press platform.
Data correspond to usage on the plateform after 2015. The current usage metrics is available 48-96 hours after online publication and is updated daily on week days.
Initial download of the metrics may take a while.