Fig. 2
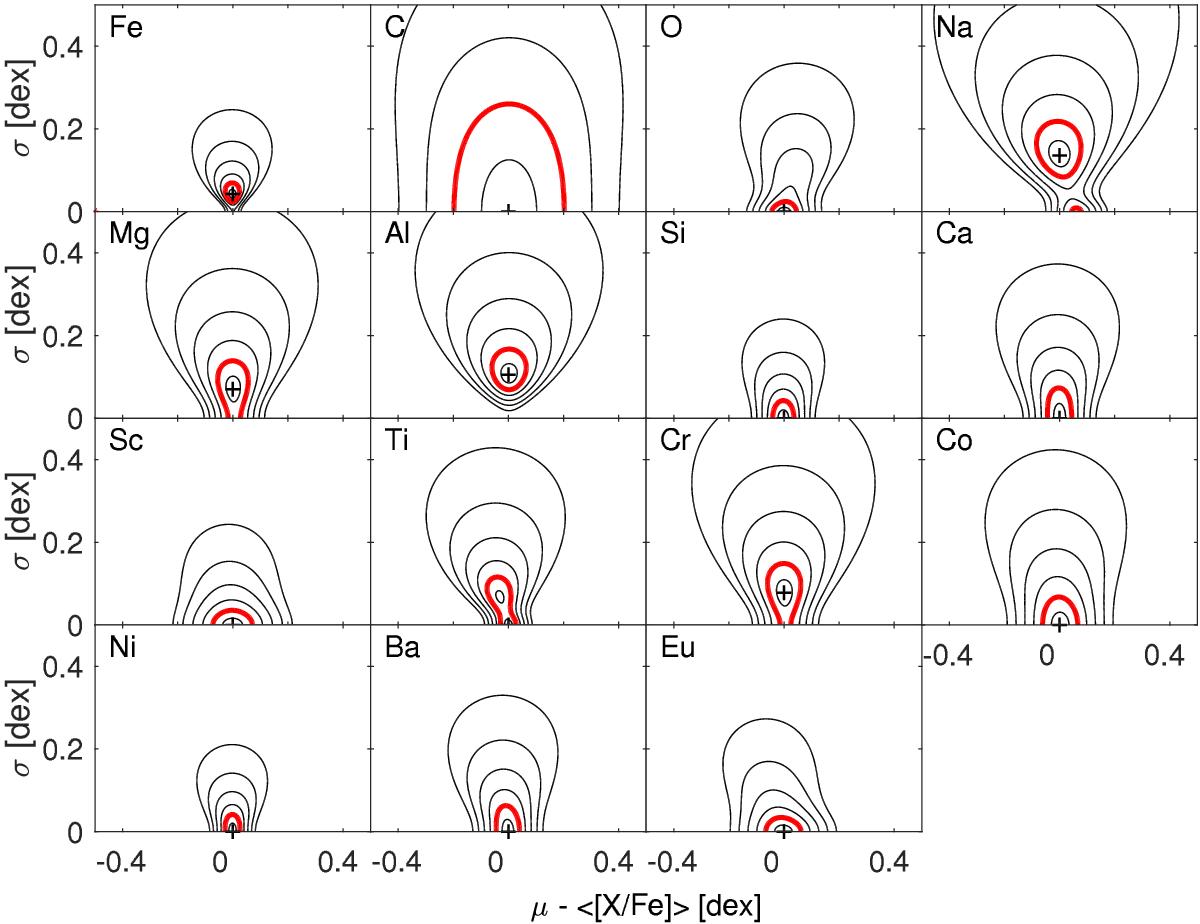
Probability distributions of the mean values (μ) and dispersions (σ) in the abundance ratios. Here, the x-axis has been normalized to zero at the observed mean of each element’s [X/Fe] to emphasize the abundance spreads. Contours are placed at 0.5–3σ in steps of 0.5, where the red curve highlights the 1σ contour. We note the significant spreads in the light elements Na, Mg, and Al.
Current usage metrics show cumulative count of Article Views (full-text article views including HTML views, PDF and ePub downloads, according to the available data) and Abstracts Views on Vision4Press platform.
Data correspond to usage on the plateform after 2015. The current usage metrics is available 48-96 hours after online publication and is updated daily on week days.
Initial download of the metrics may take a while.