Fig. 11
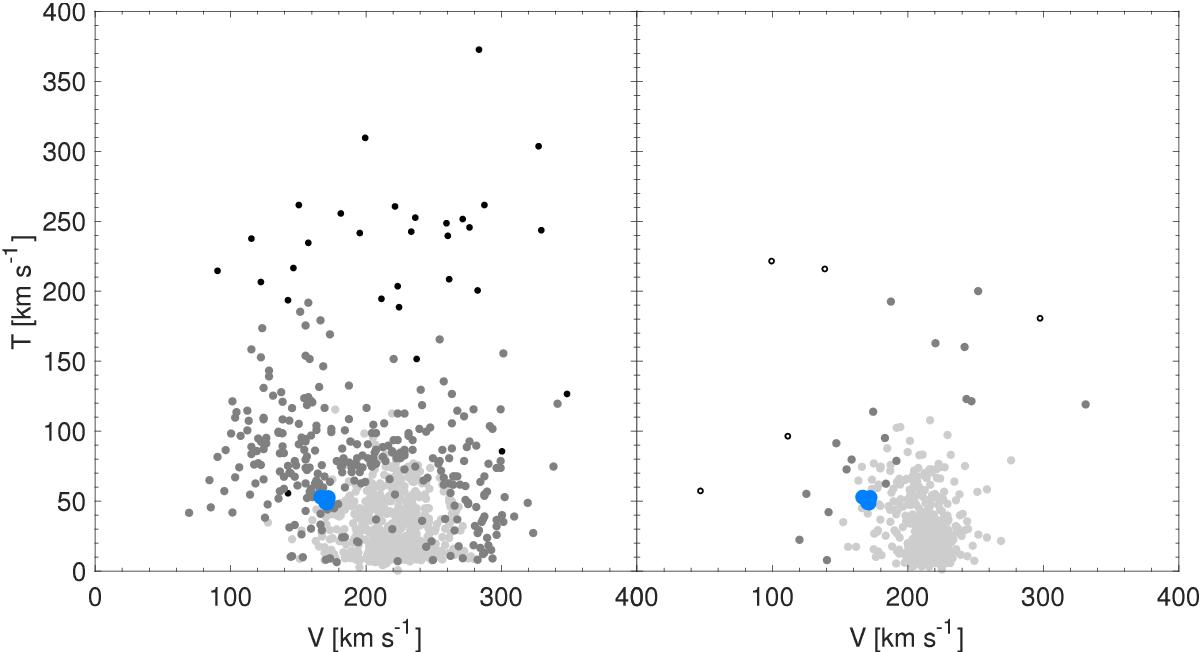
Left panel: Toomre diagram of the kinematically separated literature samples and the Gaia 1 stars. As in the previous figures, light gray points are thin disk stars, dark gray ones are for the thick disk, and black symbols denote stars on halo-like orbits. The right panel uses OCs from the compilation of Vande Putte et al. (2010) as a comparison sample, color-coded following the decomposition procedure of Bensby et al. (2014).
Current usage metrics show cumulative count of Article Views (full-text article views including HTML views, PDF and ePub downloads, according to the available data) and Abstracts Views on Vision4Press platform.
Data correspond to usage on the plateform after 2015. The current usage metrics is available 48-96 hours after online publication and is updated daily on week days.
Initial download of the metrics may take a while.