Fig. 8
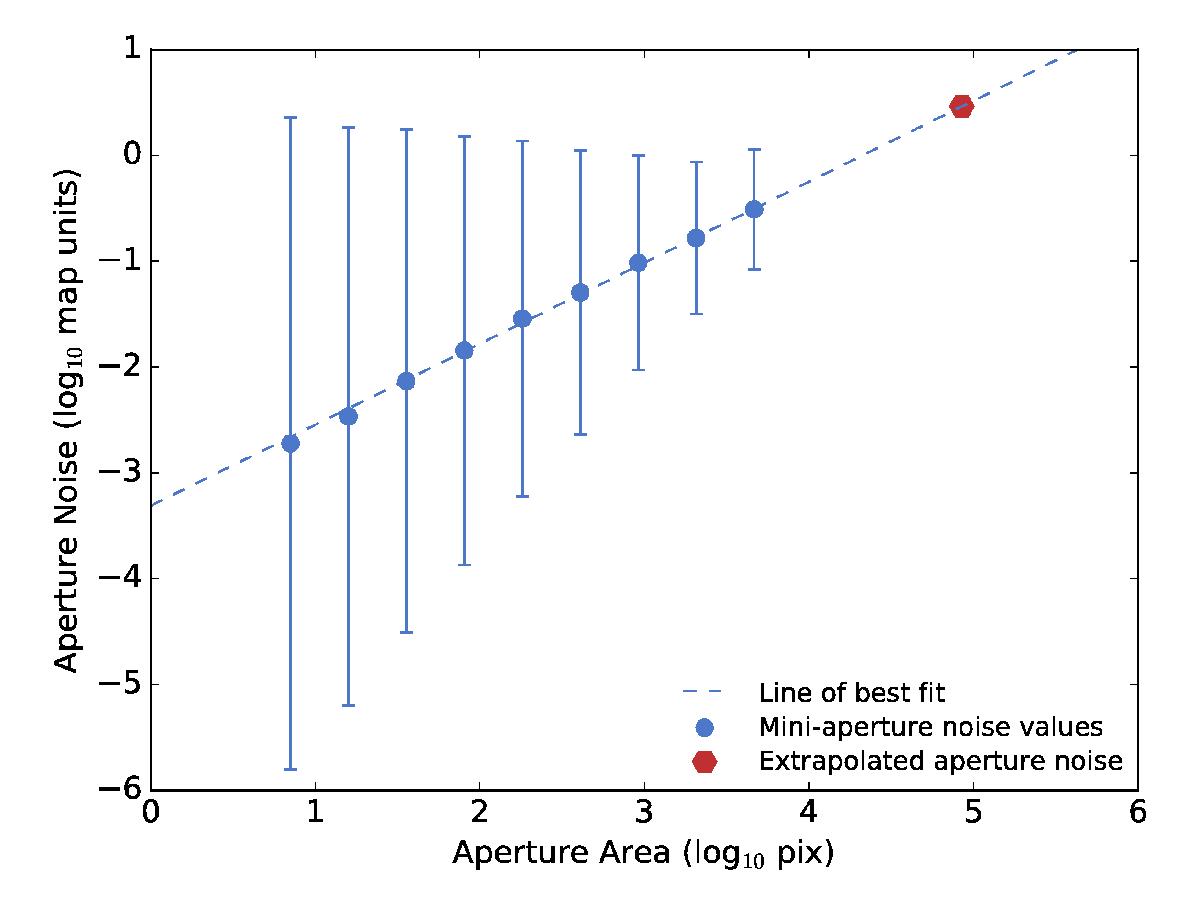
Example of how CAAPR extrapolates aperture noise, for SPIRE 250 μm photometry of M 101 (NGC 5457). Blue circles indicate aperture noise determined when using mini-apertures of different sizes. Note that the error bars do not represent uncertainties, but rather indicate weightings assigned to each point, with greater weight given to mini-apertures closer in size to the master aperture. Blue dashed line indicates best-fit power law to trend exhibited by these points. Red hexagon indicates extrapolated aperture noise for M 101, given area of its master aperture.
Current usage metrics show cumulative count of Article Views (full-text article views including HTML views, PDF and ePub downloads, according to the available data) and Abstracts Views on Vision4Press platform.
Data correspond to usage on the plateform after 2015. The current usage metrics is available 48-96 hours after online publication and is updated daily on week days.
Initial download of the metrics may take a while.