Fig. 10
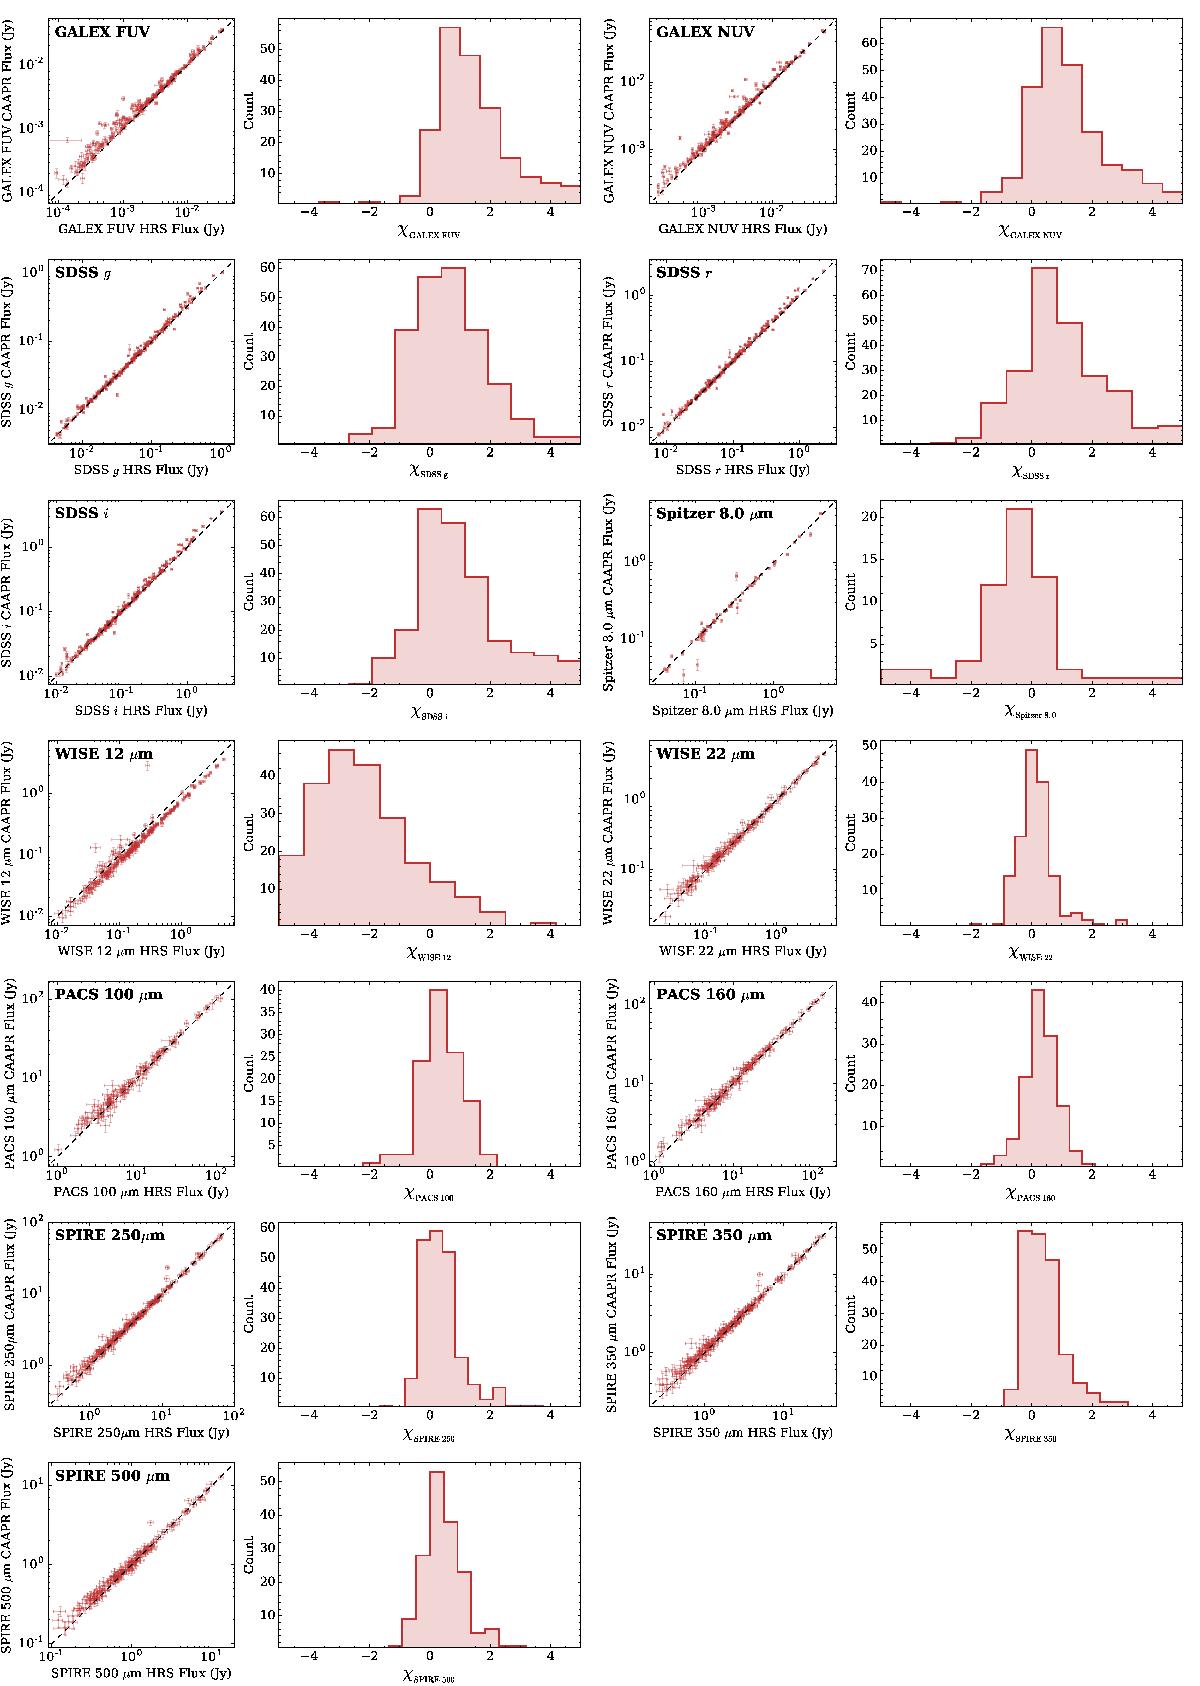
Comparison of DustPedia CAAPR and HRS photometry. Left-hand plot for each band directly plots CAAPR and HRS photometry against each other, with 1:1 relationship indicated by dashed black line. Right-hand plot for each band shows χ (as per Eq. (1)) distribution for that set of fluxes (binning dictated by the Freedman-Diaconis rule; Freedman & Diaconis 1981). Noticeable deviations for GALEX FUV, GALEX NUV, and WISE 12 μm are addressed in Sects. 6.3.1 and 6.3.1.
Current usage metrics show cumulative count of Article Views (full-text article views including HTML views, PDF and ePub downloads, according to the available data) and Abstracts Views on Vision4Press platform.
Data correspond to usage on the plateform after 2015. The current usage metrics is available 48-96 hours after online publication and is updated daily on week days.
Initial download of the metrics may take a while.