Fig. 6
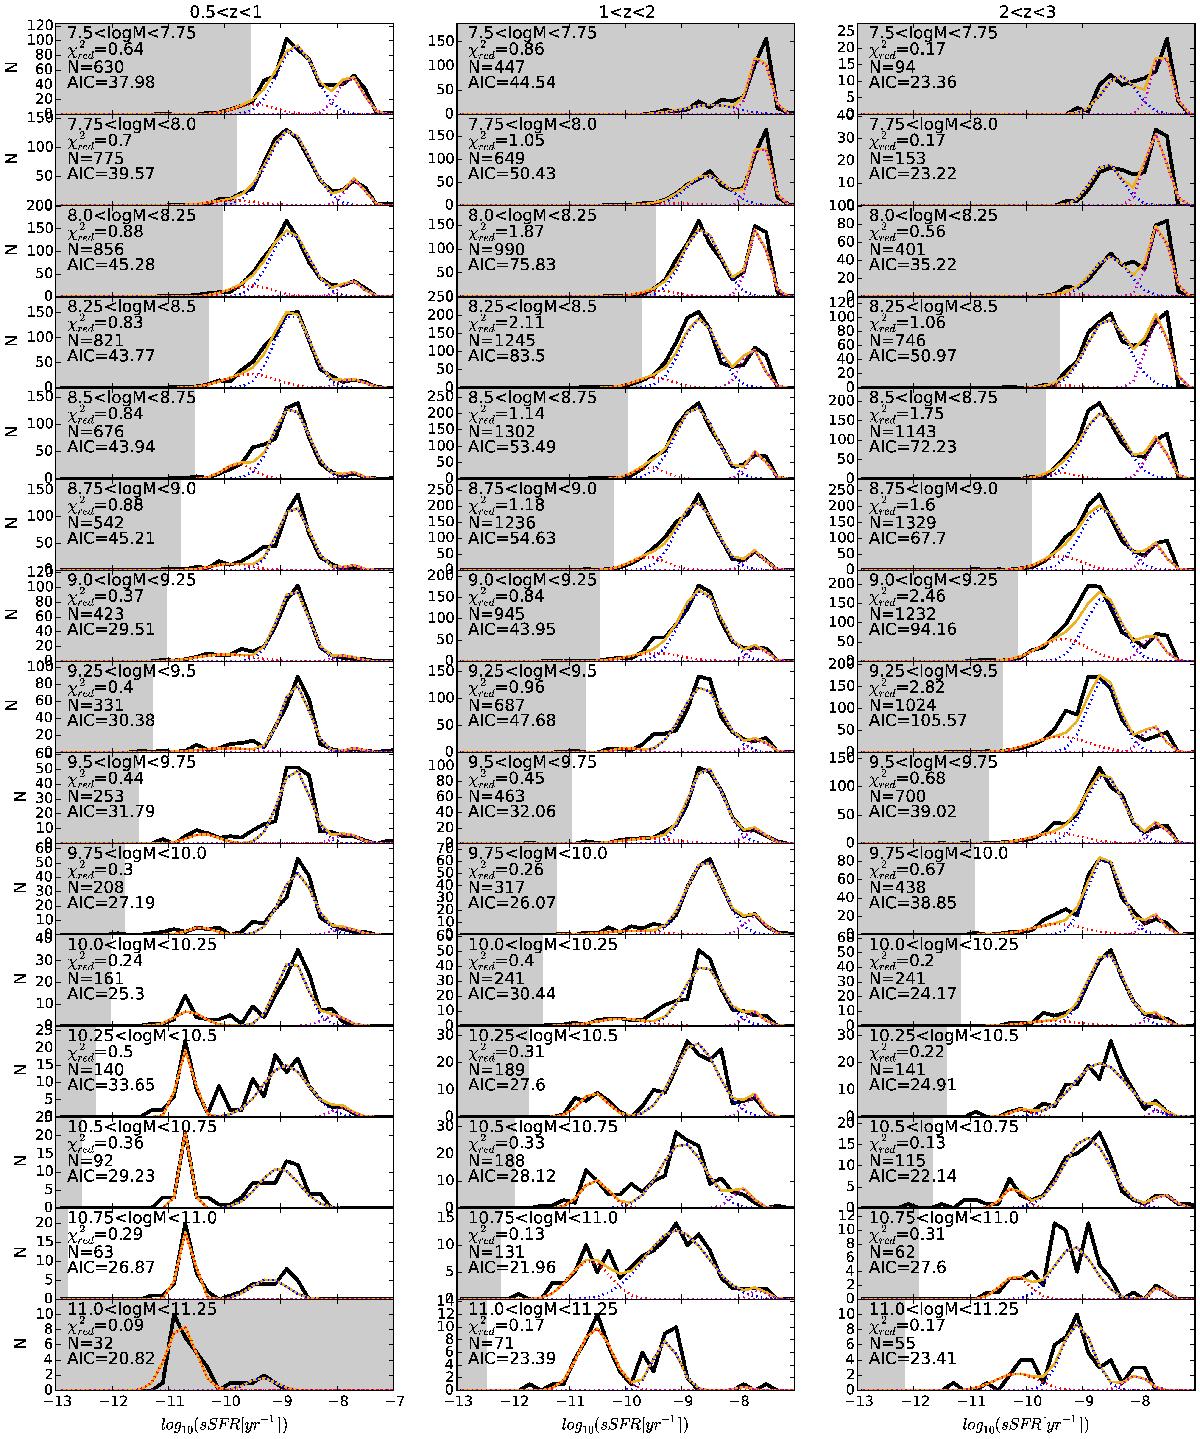
sSFR distribution of the CANDELS sample in different z and stellar-mass bins. Each column shows a different redshift bin: ![]() (left),
(left), ![]() (central) and
(central) and ![]() (right). Each row shows a different stellar-mass bin, with a width of 0.25 dex, from
(right). Each row shows a different stellar-mass bin, with a width of 0.25 dex, from ![]() (top) to
(top) to ![]() (bottom). Black thick continuous lines show the sSFR distribution and the yellow thin continuous lines are the best fitted models. Dotted lines are the different Gaussian components: quenched galaxies (red), MS galaxies (blue) and starburst galaxies (magenta). The
(bottom). Black thick continuous lines show the sSFR distribution and the yellow thin continuous lines are the best fitted models. Dotted lines are the different Gaussian components: quenched galaxies (red), MS galaxies (blue) and starburst galaxies (magenta). The ![]() and AIC values of each fit and the number of galaxies in each bin are shown in the top left of each panel. Grey areas show the sSFRs and stellar masses for which this sample is not complete (below the 3σ limit in sSFR or below the 90% completeness in stellar mass), or has statistics that are too low (N< 50).
and AIC values of each fit and the number of galaxies in each bin are shown in the top left of each panel. Grey areas show the sSFRs and stellar masses for which this sample is not complete (below the 3σ limit in sSFR or below the 90% completeness in stellar mass), or has statistics that are too low (N< 50).
Current usage metrics show cumulative count of Article Views (full-text article views including HTML views, PDF and ePub downloads, according to the available data) and Abstracts Views on Vision4Press platform.
Data correspond to usage on the plateform after 2015. The current usage metrics is available 48-96 hours after online publication and is updated daily on week days.
Initial download of the metrics may take a while.