Fig. 5
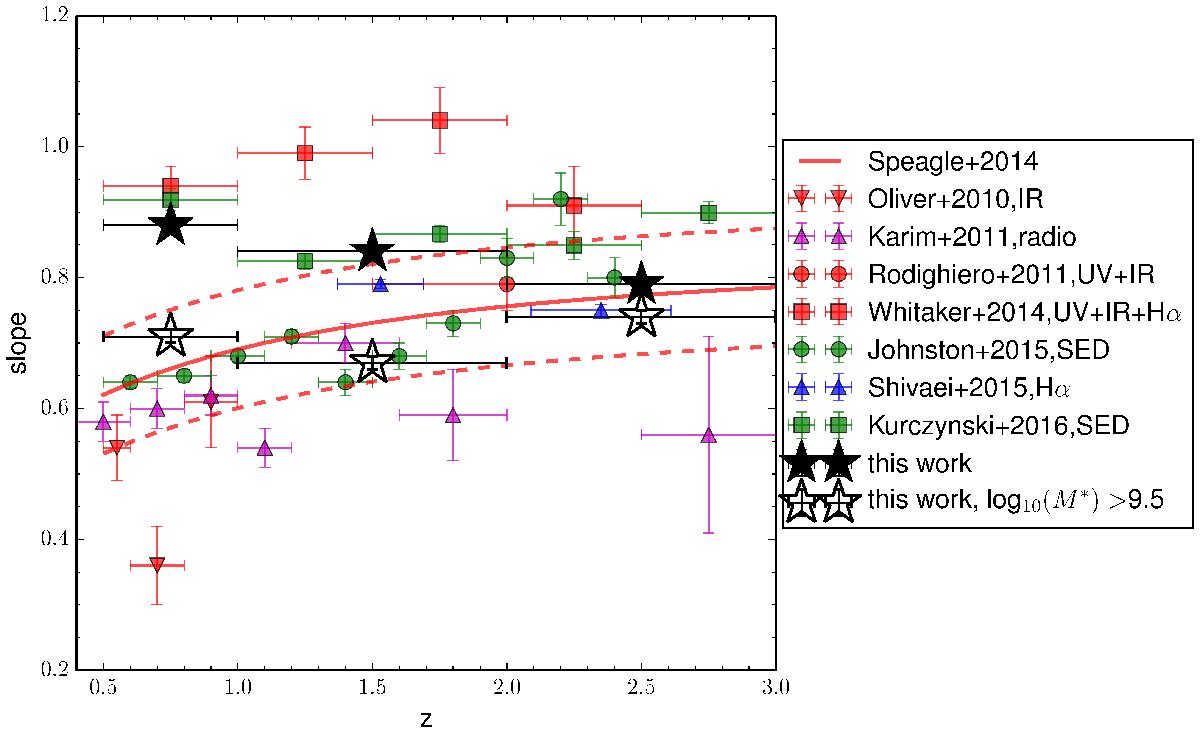
Comparison between some MS slopes present in the literature and the slopes derived in this work using all SF galaxies (black stars) and only SF galaxies with log10(M∗/M0) > 9.5 (empty stars). All other slopes are taken from: Oliver et al. (2010; red triangles), Karim et al. (2011; magenta triangles), Rodighiero et al. (2011; red circles), Whitaker et al. (2014; red squares), Johnston et al. (2015; green circles), Shivaei et al. (2015; blue triangles) and Kurczynski et al. (2016; green squares). The red continuous line shows the relation derived by Speagle et al. (2014) and the dotted red lines are the median inter-publication scatter around the fit.
Current usage metrics show cumulative count of Article Views (full-text article views including HTML views, PDF and ePub downloads, according to the available data) and Abstracts Views on Vision4Press platform.
Data correspond to usage on the plateform after 2015. The current usage metrics is available 48-96 hours after online publication and is updated daily on week days.
Initial download of the metrics may take a while.