Fig. 2
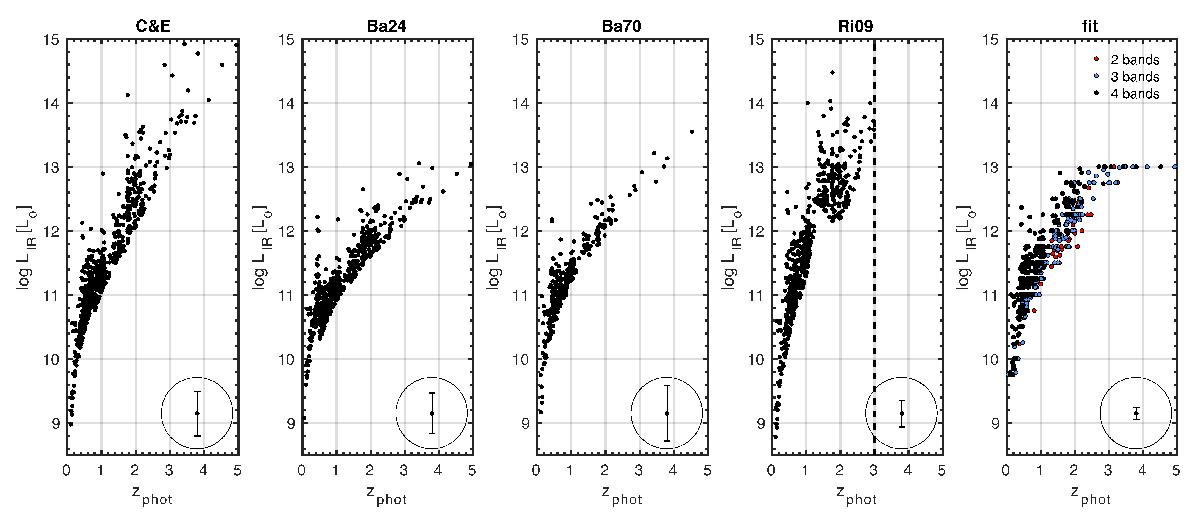
Photometric redshift compared to the IR luminosity derived using different methods: from left to right: C&E, Ba24, Ba70, Ri09 and IR SED fitting. In the fourth panel, the dashed vertical line corresponds to the redshift limit below which the relation to derive IR luminosity is calibrated. In the third panel, open symbols are upper limits. In the fifth panel, points are colour-coded depending on the number of bands with detection: (black) 4 bands, (blue) 3 bands and (red) 2 bands. On the bottom part of each plot, it is shown the mean error bar associate to each method.
Current usage metrics show cumulative count of Article Views (full-text article views including HTML views, PDF and ePub downloads, according to the available data) and Abstracts Views on Vision4Press platform.
Data correspond to usage on the plateform after 2015. The current usage metrics is available 48-96 hours after online publication and is updated daily on week days.
Initial download of the metrics may take a while.