Fig. A.1
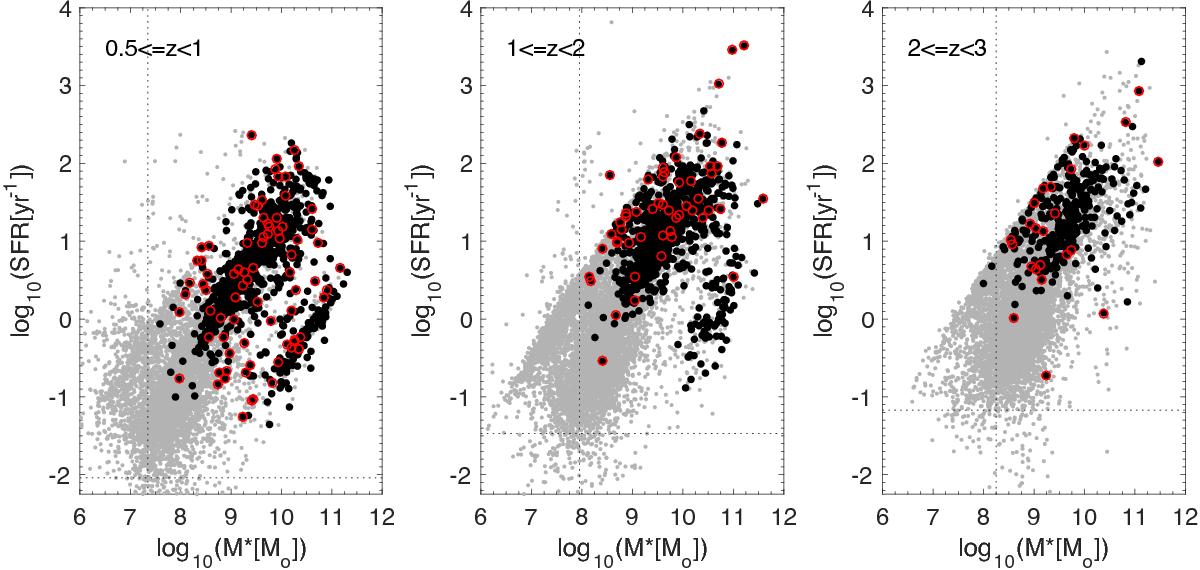
SFR–M∗ plane. Grey points are all galaxies in the sample analysed in this work, black dots are galaxies in the same sample with spectroscopic redshift, and red circles are galaxies that are outliers in redshift. Each column shows a different redshift bin: ![]() (left),
(left), ![]() (central) and
(central) and ![]() (right). The vertical black dotted lines are the 90% completeness limit in stellar mass in each redshift bin. The horizontal dotted black lines are the 3σ detection limit in SFR in each redshift bin.
(right). The vertical black dotted lines are the 90% completeness limit in stellar mass in each redshift bin. The horizontal dotted black lines are the 3σ detection limit in SFR in each redshift bin.
Current usage metrics show cumulative count of Article Views (full-text article views including HTML views, PDF and ePub downloads, according to the available data) and Abstracts Views on Vision4Press platform.
Data correspond to usage on the plateform after 2015. The current usage metrics is available 48-96 hours after online publication and is updated daily on week days.
Initial download of the metrics may take a while.