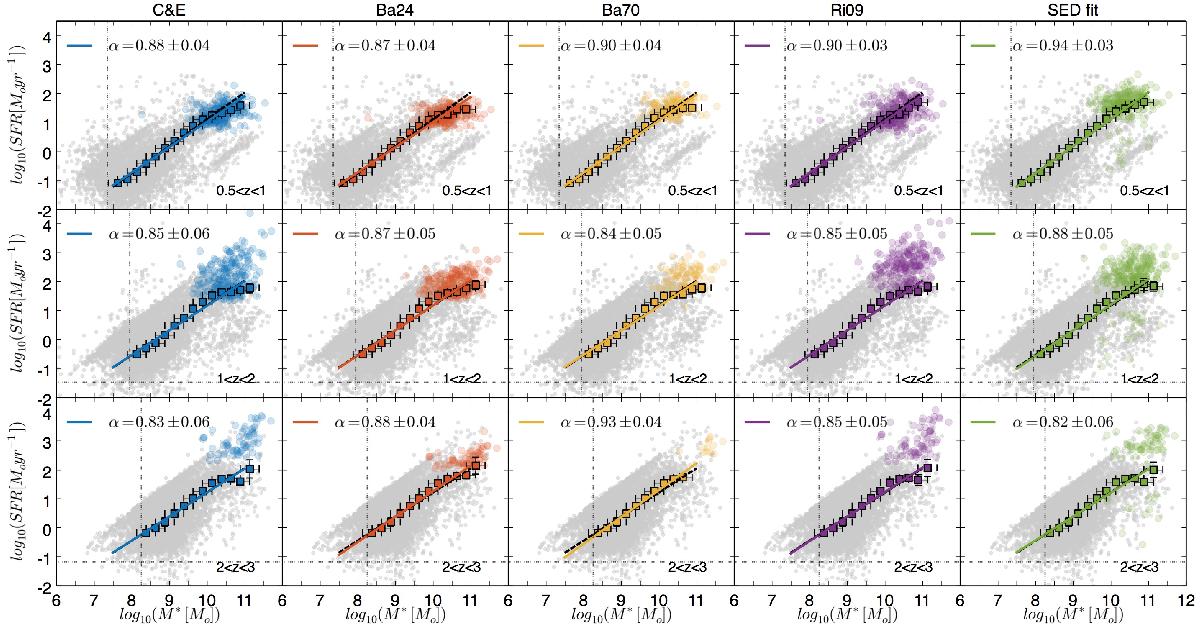
Fig. 10

SFR versus stellar mass for different redshift bins. From top to bottom: redshifts 0.5 ≤ z< 1, 1 ≤ z< 2 and 2 <z< 3. Grey points are all CANDELS data in the GOODS-S without IR observations and their SFR is derived from the UV. Coloured points in each panel are the 24 μm detected galaxies and in each column their SFR are obtained with different methods. From left to right: C&E, Ba24, Ba70, Ri09 and IR SED fitting. In each panel, the black dashed line shows the best fit for the MS for the CANDELS data with SFR derived only from the UV, as shown in Fig. 5. The coloured lines show the best fit adding the 24 μm detected galaxies and the slope values of each MS is reported at the top left of each panel. Each MS is derived with an ODR fit using the Gaussian mean position derived fitting the sSFR distribution in each stellar mass bin. The mean positions of the MS Gaussian component in each stellar mass bin is shown in each panel with coloured squares. Error bars are the errors in the mean position of the MS Gaussian component derived from the fit.
Current usage metrics show cumulative count of Article Views (full-text article views including HTML views, PDF and ePub downloads, according to the available data) and Abstracts Views on Vision4Press platform.
Data correspond to usage on the plateform after 2015. The current usage metrics is available 48-96 hours after online publication and is updated daily on week days.
Initial download of the metrics may take a while.


