Fig. 8
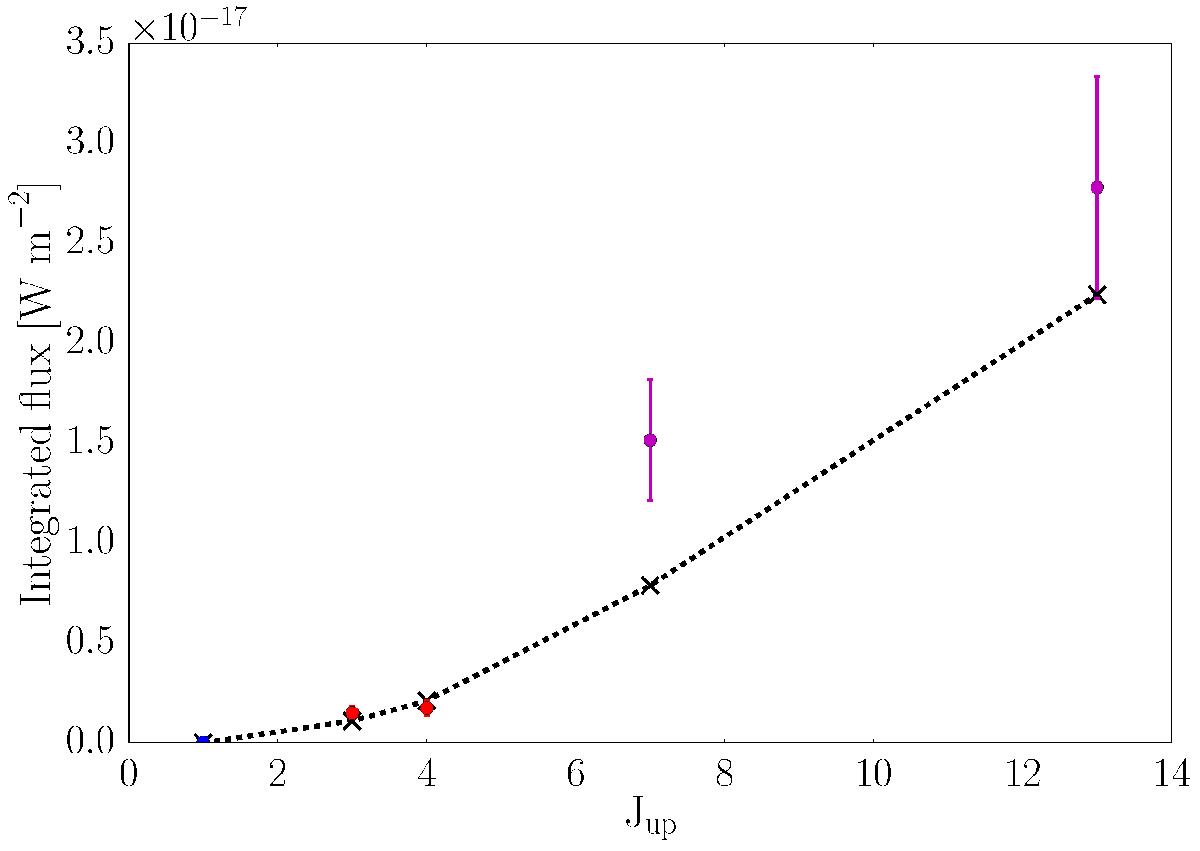
Black: integrated line strengths of HCN modelled using a Gaussian abundance profile characterised by f0 = 5.0 × 10⁻⁷ with respect to H2 and re = 1.8 × 1015 cm. Overplotted are the integrated line strengths measured with APEX (red circles), SEST (blue circles), and HIFI (purple circles). The error bars for the resolved molecular lines correspond to an absolute error of 20%.
Current usage metrics show cumulative count of Article Views (full-text article views including HTML views, PDF and ePub downloads, according to the available data) and Abstracts Views on Vision4Press platform.
Data correspond to usage on the plateform after 2015. The current usage metrics is available 48-96 hours after online publication and is updated daily on week days.
Initial download of the metrics may take a while.