Fig. B.1
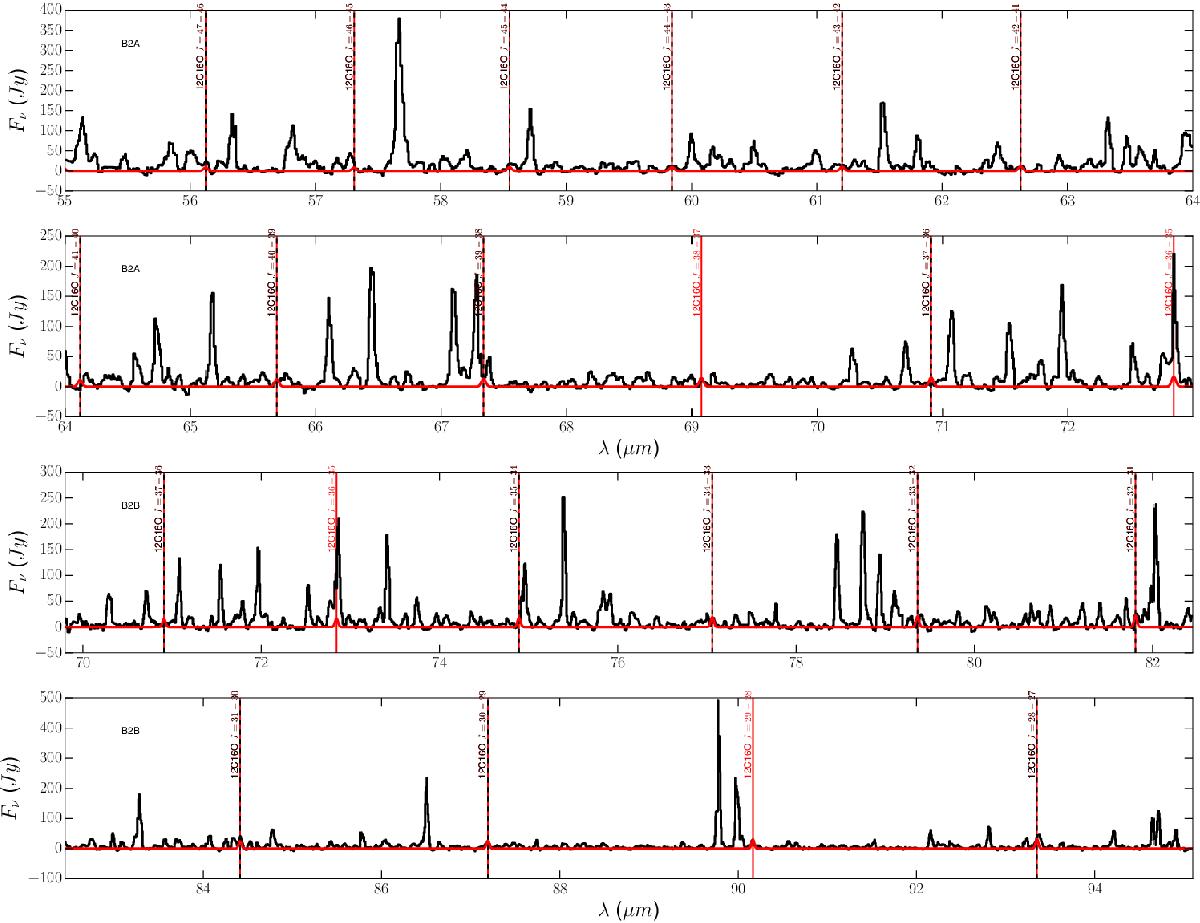
Black: continuum-subtracted PACS spectrum of R Dor for the blue bands. Red: modelled spectrum. The PACS band is indicated in the upper left corner of each spectrum. The abundance profile used for SiO is characterised by f0 = 6.0 × 10⁻⁵ relative to H2 and e-folding radius re = 4 × 1013 cm with Rdecl = 50 R∗. The abundance profile used for HCN is characterised by f0 = 5.5 × 10⁻⁷ with respect to H2 and re = 1.5 × 1015 cm. The modelled transitions are shown by coloured vertical lines: CO in red, SiO in green, and HCN in blue. Dashed lines indicate modelled transitions that were not detected or that contribute to a blended line.
Current usage metrics show cumulative count of Article Views (full-text article views including HTML views, PDF and ePub downloads, according to the available data) and Abstracts Views on Vision4Press platform.
Data correspond to usage on the plateform after 2015. The current usage metrics is available 48-96 hours after online publication and is updated daily on week days.
Initial download of the metrics may take a while.