Fig. A.2
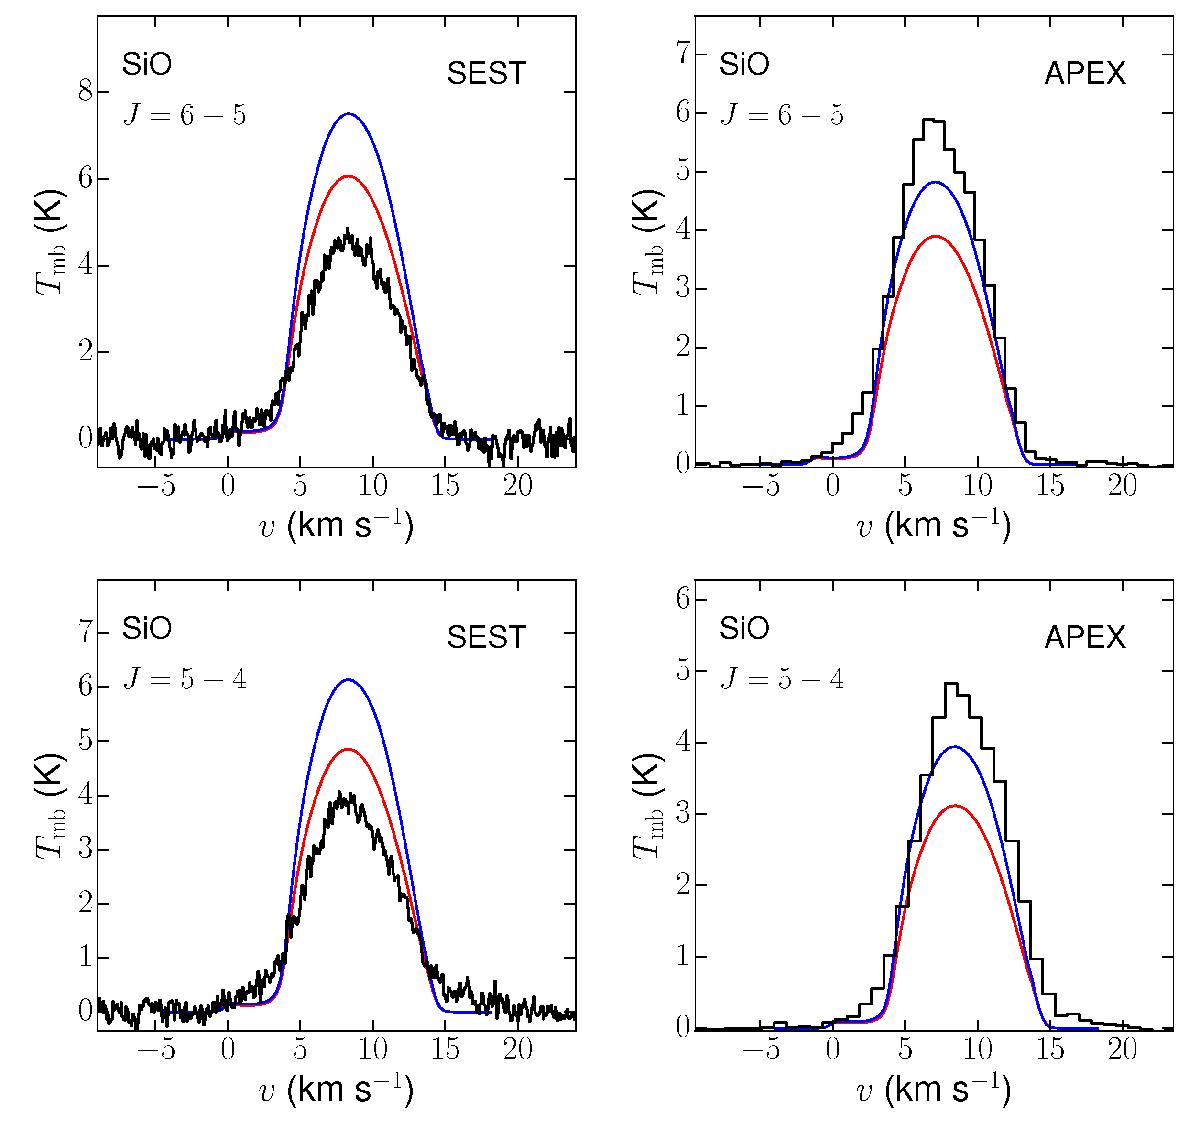
Black: resolved line profiles of the SiO J = 6–5 and 5–4 molecular transitions observed by APEX and SEST in November 2014 and December 1992, respectively. Blue: predicted line profiles using L∗ = 4500 L⊙ (assumed throughout the modelling) and an abundance profile characterised by f0 = 6.0 × 10⁻⁵ relative to H2 and e-folding radius re = 4 × 1013 cm with Rdecl = 50 R∗. Red: predicted line profiles using L∗ = 2500 L⊙ and the same abundance profile.
Current usage metrics show cumulative count of Article Views (full-text article views including HTML views, PDF and ePub downloads, according to the available data) and Abstracts Views on Vision4Press platform.
Data correspond to usage on the plateform after 2015. The current usage metrics is available 48-96 hours after online publication and is updated daily on week days.
Initial download of the metrics may take a while.