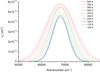
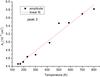
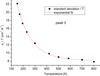
Fig. 5
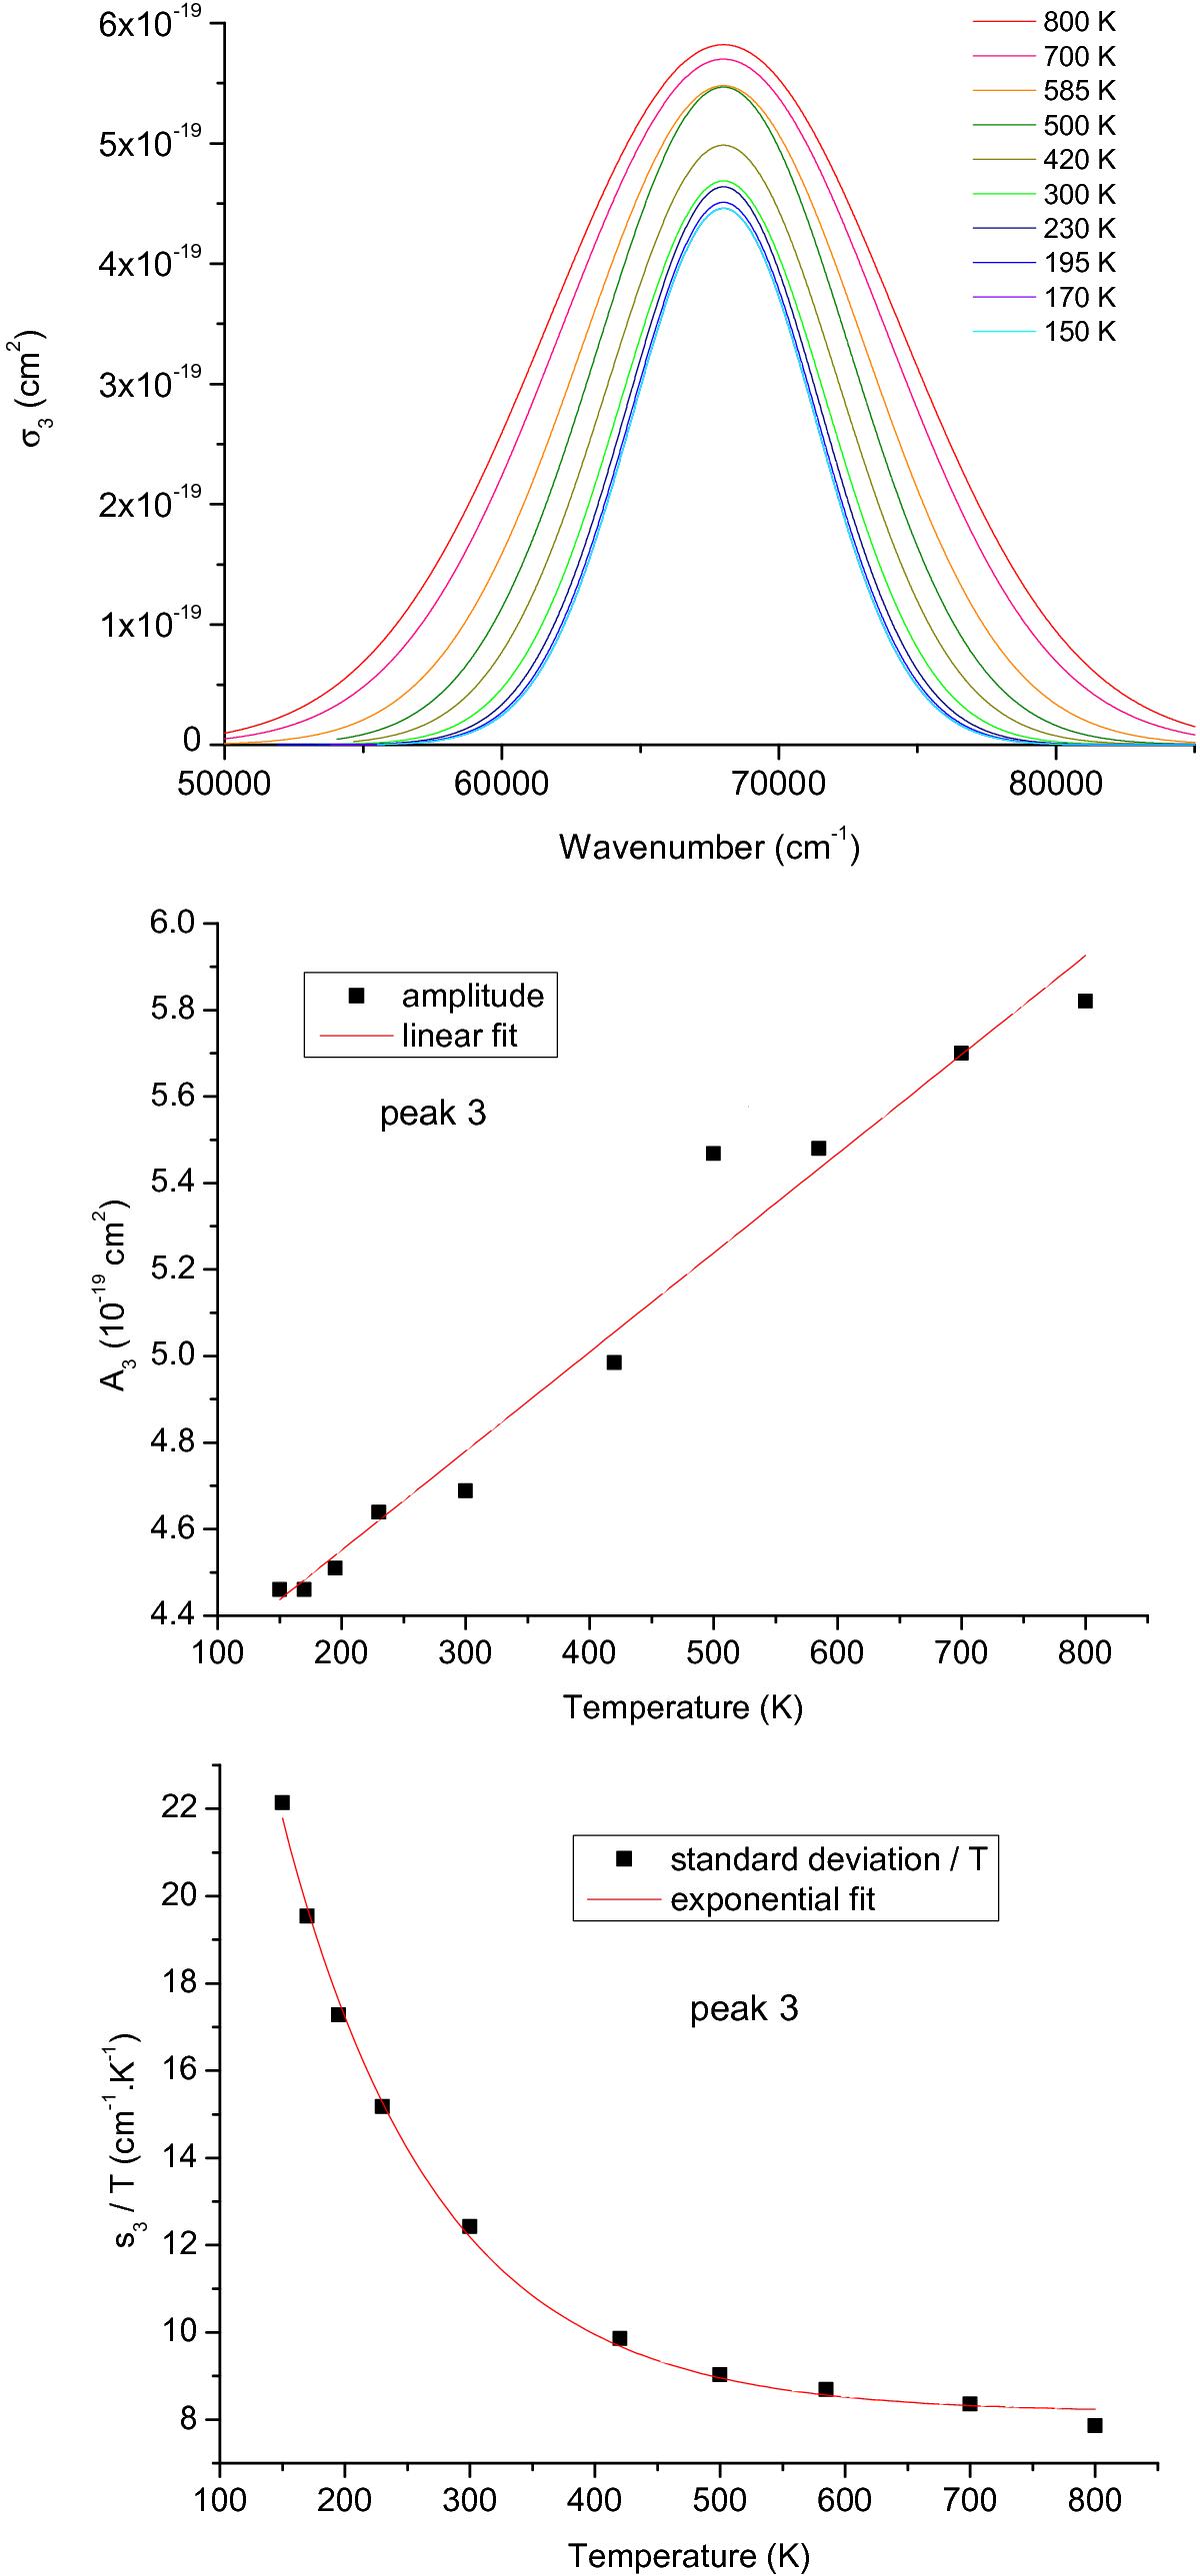
Top: analytical representation of the third peak of σcont(λ,T) with a Gaussian function, σ3(λ,T), centred at 68 000 cm-1 for temperatures between 150 and 800 K. Middle: variation of the amplitude A3 of the third Gaussian function as a function of the temperature. The variation can be fitted by a linear function. Bottom: variation of the standard deviation s3(T) /T of the third Gaussian function as a function of the temperature. The variation can be fitted by a decreasing exponential function.
Current usage metrics show cumulative count of Article Views (full-text article views including HTML views, PDF and ePub downloads, according to the available data) and Abstracts Views on Vision4Press platform.
Data correspond to usage on the plateform after 2015. The current usage metrics is available 48-96 hours after online publication and is updated daily on week days.
Initial download of the metrics may take a while.