Free Access
Fig. 17
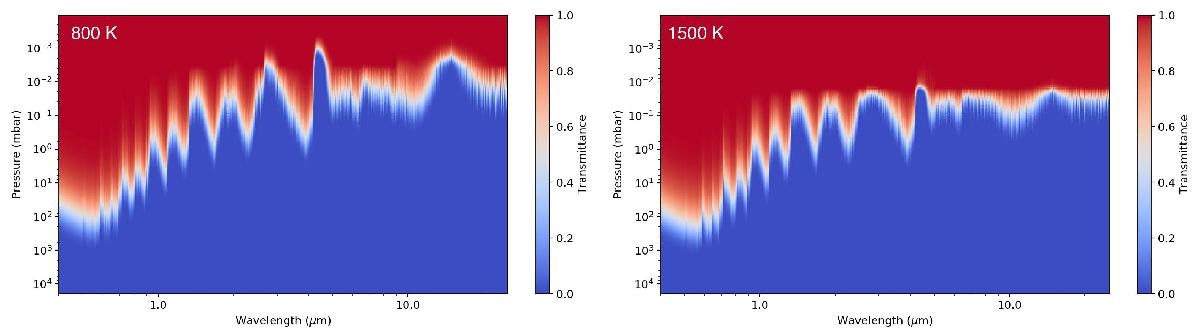
Spectral transmittance as a function of pressure for the 800 K (left) and the 1500 K atmospheres (right). The plots correspond to the case where CO2 absorption cross sections at respectively 800 K and 1500 K have been used.
This figure is made of several images, please see below:
Current usage metrics show cumulative count of Article Views (full-text article views including HTML views, PDF and ePub downloads, according to the available data) and Abstracts Views on Vision4Press platform.
Data correspond to usage on the plateform after 2015. The current usage metrics is available 48-96 hours after online publication and is updated daily on week days.
Initial download of the metrics may take a while.