Free Access
Fig. 11
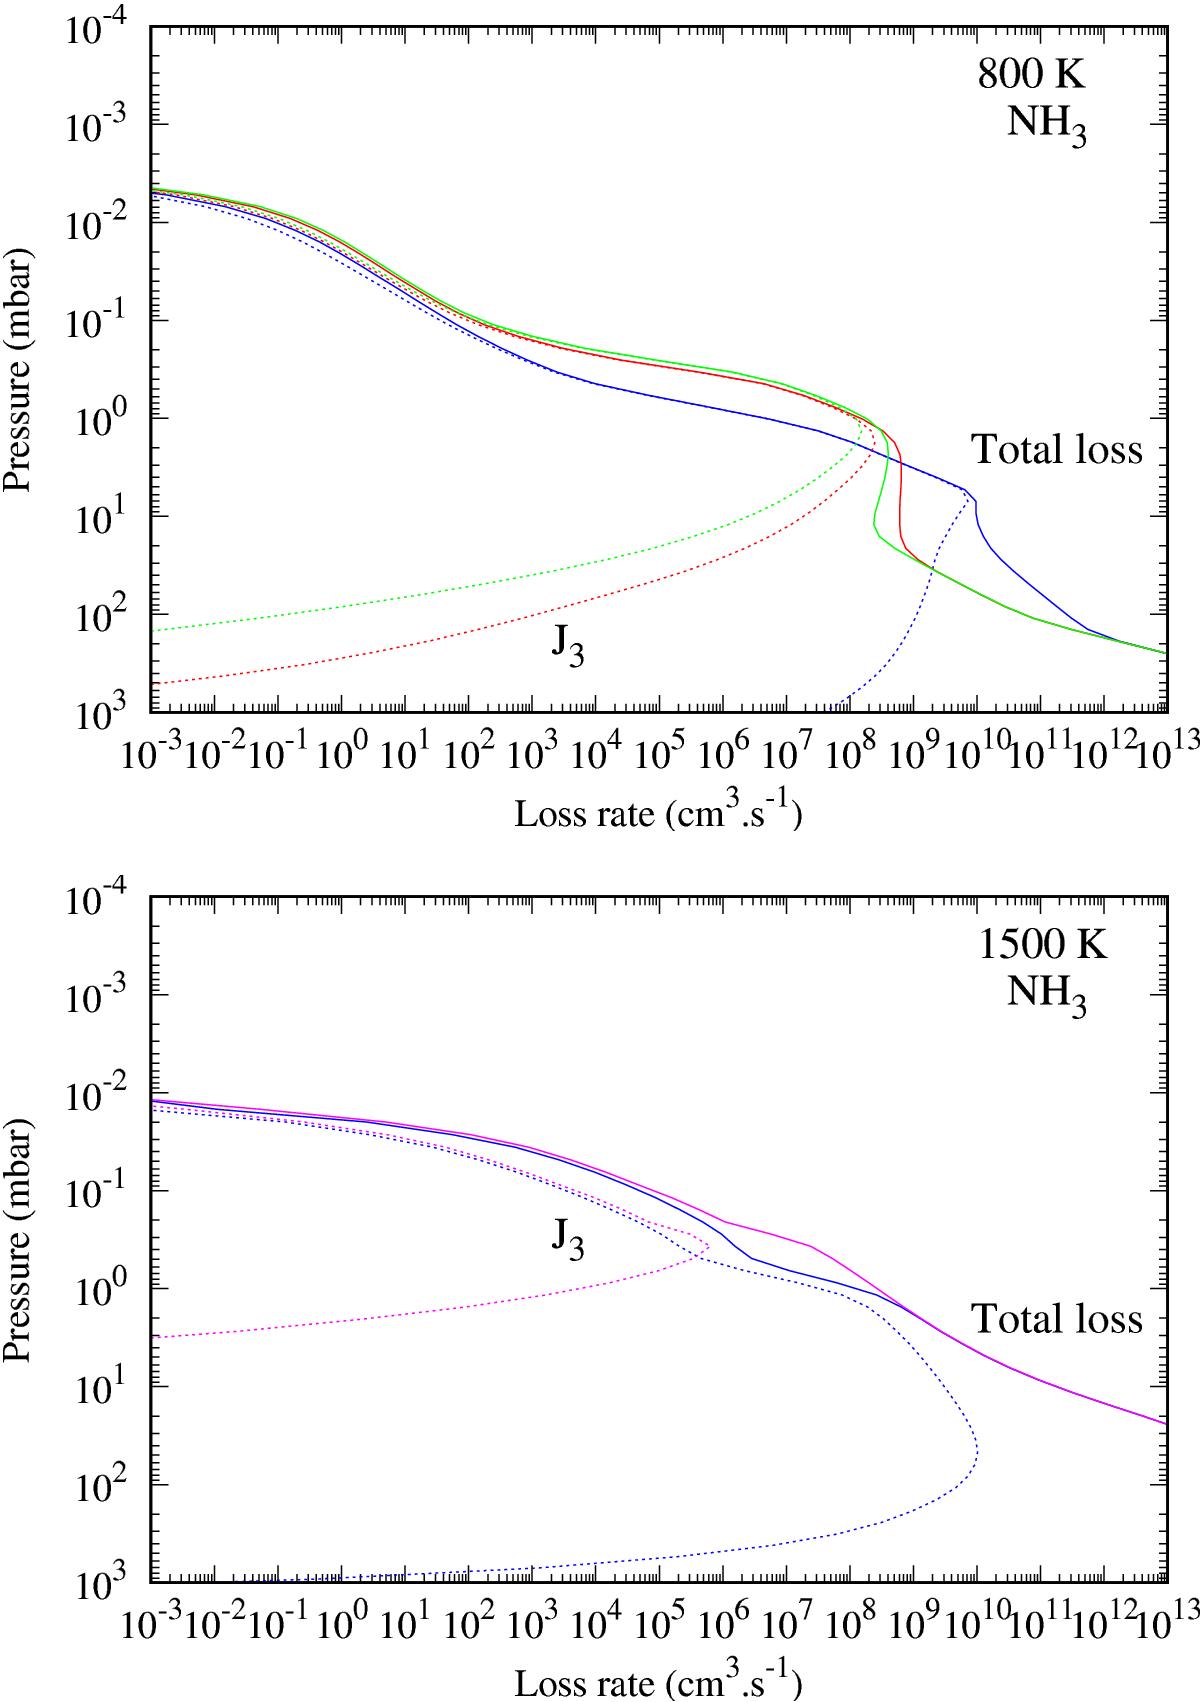
For NH3, total loss rates (full line) and loss rates due to photolysis J3 (dotted line) in the two atmospheric models: 800 K (top) and 1500 K (bottom). Colours correspond to the different absorption cross section used: σCO2(λ,300) (blue), σCO2(λ,800) (red), σcont(λ,800) (green), and σcont(λ,1500) (pink).
This figure is made of several images, please see below:
Current usage metrics show cumulative count of Article Views (full-text article views including HTML views, PDF and ePub downloads, according to the available data) and Abstracts Views on Vision4Press platform.
Data correspond to usage on the plateform after 2015. The current usage metrics is available 48-96 hours after online publication and is updated daily on week days.
Initial download of the metrics may take a while.