Fig. 9
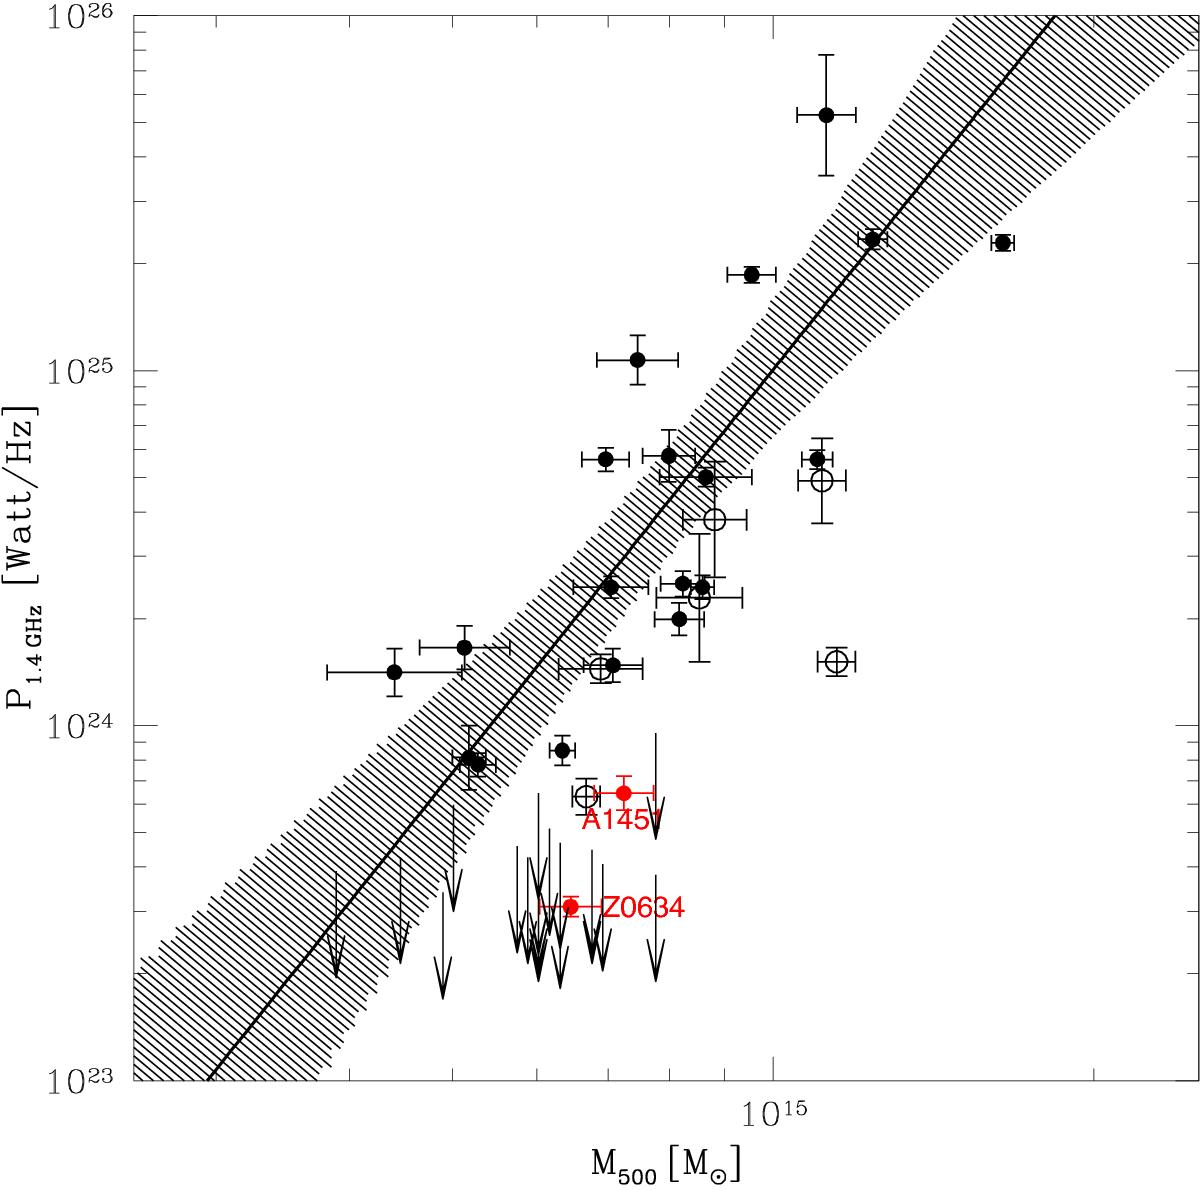
Distribution of clusters in the P1.4 GHz−M500 diagram. Different symbols indicate giant radio halos (black filled dots), ultra steep spectrum radio halos (black empty dots) and upper limits (black arrows) belonging to the Cassano et al. (2013) sample. The red dots represent the two clusters presented in this paper. The best fit relation for giant radio halos (black line) and the 95% confidence level (shadowed region) from Cassano et al. (2013) are shown.
Current usage metrics show cumulative count of Article Views (full-text article views including HTML views, PDF and ePub downloads, according to the available data) and Abstracts Views on Vision4Press platform.
Data correspond to usage on the plateform after 2015. The current usage metrics is available 48-96 hours after online publication and is updated daily on week days.
Initial download of the metrics may take a while.