Free Access
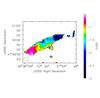
Fig. 8
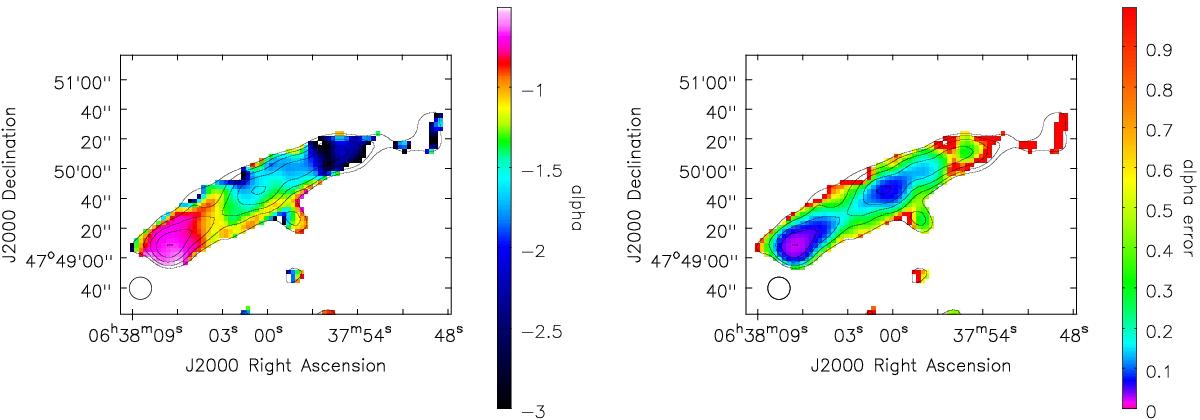
Spectral index map (left) and associated spectral index error map (right) of the HT in Z0634 between 320 MHz and 1.5 GHz at resolution 15′′ × 15′′. GMRT 320 MHZ contours of the image used to make the spectral index map are drawn in black. Contours levels start from 0.42 mJy/beam and are spaced by a factor 2.
This figure is made of several images, please see below:
Current usage metrics show cumulative count of Article Views (full-text article views including HTML views, PDF and ePub downloads, according to the available data) and Abstracts Views on Vision4Press platform.
Data correspond to usage on the plateform after 2015. The current usage metrics is available 48-96 hours after online publication and is updated daily on week days.
Initial download of the metrics may take a while.